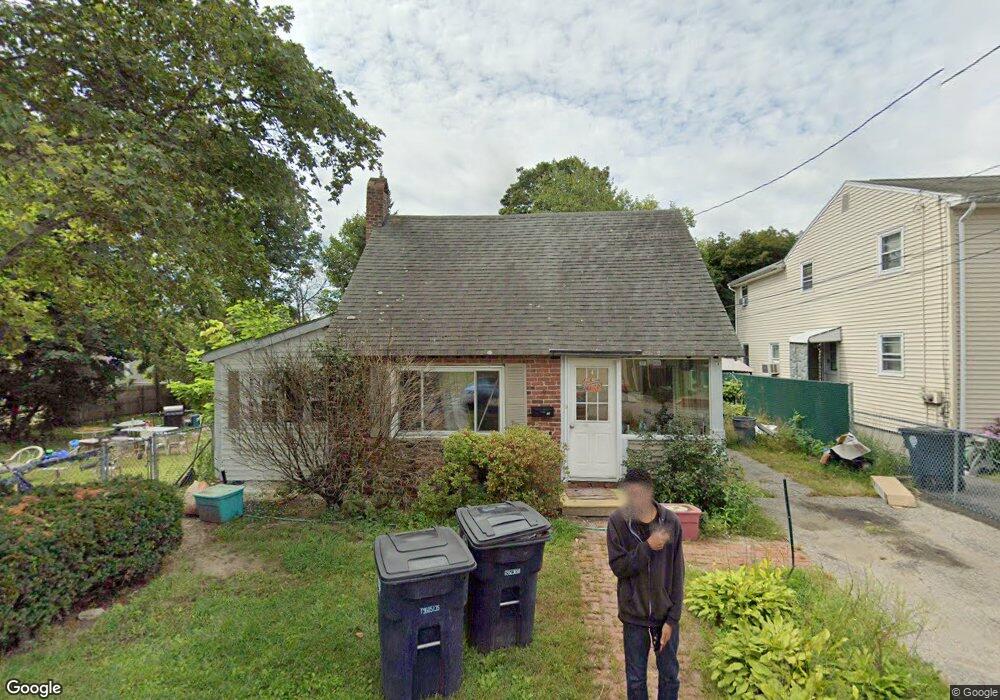
25 Hunt St Nashua, NH 03060
South End Nashua NeighborhoodEstimated Value: $316,171 - $388,000
2
Beds
1
Bath
820
Sq Ft
$441/Sq Ft
Est. Value
About This Home
This home is located at 25 Hunt St, Nashua, NH 03060 and is currently estimated at $361,543, approximately $440 per square foot. 25 Hunt St is a home located in Hillsborough County with nearby schools including Fairgrounds Elementary School, Fairgrounds Middle School, and Nashua High School South.
Ownership History
Date
Name
Owned For
Owner Type
Purchase Details
Closed on
Feb 27, 2020
Sold by
25 Hunt Street Rt and Vasel
Bought by
Vasel William J and Vasel Katherine
Current Estimated Value
Home Financials for this Owner
Home Financials are based on the most recent Mortgage that was taken out on this home.
Original Mortgage
$147,000
Outstanding Balance
$129,628
Interest Rate
3.5%
Mortgage Type
New Conventional
Estimated Equity
$231,915
Purchase Details
Closed on
Apr 13, 2007
Sold by
Kane Michael D
Bought by
Vasel William J and Vasel Katherine A
Home Financials for this Owner
Home Financials are based on the most recent Mortgage that was taken out on this home.
Original Mortgage
$121,600
Interest Rate
6.24%
Mortgage Type
Purchase Money Mortgage
Purchase Details
Closed on
Aug 3, 1998
Sold by
Bates Arnold H and Bates Jean H
Bought by
Kane Michael D
Create a Home Valuation Report for This Property
The Home Valuation Report is an in-depth analysis detailing your home's value as well as a comparison with similar homes in the area
Home Values in the Area
Average Home Value in this Area
Purchase History
| Date | Buyer | Sale Price | Title Company |
|---|---|---|---|
| Vasel William J | -- | None Available | |
| Vasel William J | -- | None Available | |
| Vasel William J | -- | None Available | |
| Vasel William J | $162,200 | -- | |
| Vasel William J | $162,200 | -- | |
| Kane Michael D | $82,000 | -- | |
| Kane Michael D | $82,000 | -- |
Source: Public Records
Mortgage History
| Date | Status | Borrower | Loan Amount |
|---|---|---|---|
| Open | Vasel William J | $147,000 | |
| Closed | Vasel William J | $147,000 | |
| Previous Owner | Kane Michael D | $121,600 | |
| Previous Owner | Kane Michael D | $25,000 |
Source: Public Records
Tax History Compared to Growth
Tax History
| Year | Tax Paid | Tax Assessment Tax Assessment Total Assessment is a certain percentage of the fair market value that is determined by local assessors to be the total taxable value of land and additions on the property. | Land | Improvement |
|---|---|---|---|---|
| 2024 | $4,366 | $274,600 | $126,900 | $147,700 |
| 2023 | $4,257 | $233,500 | $101,500 | $132,000 |
| 2022 | $4,588 | $253,900 | $121,900 | $132,000 |
| 2021 | $3,885 | $167,300 | $81,300 | $86,000 |
| 2020 | $3,783 | $167,300 | $81,300 | $86,000 |
| 2019 | $3,640 | $167,300 | $81,300 | $86,000 |
| 2018 | $3,548 | $167,300 | $81,300 | $86,000 |
| 2017 | $3,146 | $140,100 | $70,400 | $69,700 |
| 2016 | $8,476 | $140,100 | $70,400 | $69,700 |
| 2015 | $3,437 | $140,100 | $70,400 | $69,700 |
| 2014 | $3,369 | $140,100 | $70,400 | $69,700 |
Source: Public Records
Map
Nearby Homes
- 97 Linwood St
- 63 Dexter St
- 15 Lovell St Unit 3
- 15 Lovell St Unit 7
- 15 Lovell St Unit 10
- 22 Wilder St
- 4 Badger St
- 22 Kern Dr
- 30 Gingras Dr
- 169A W Hollis St Unit 193
- 8 Buck St Unit 10
- 6 Hayden St
- 1 Circle Ave
- 15 Learned St Unit 123
- 22 New Dunstable Rd Unit 132133
- 27 Fifield St Unit 13
- 30 Ledge St
- 17 Herrick St
- 41 New Dunstable Rd Unit 371
- 36 Eastman St Unit 26