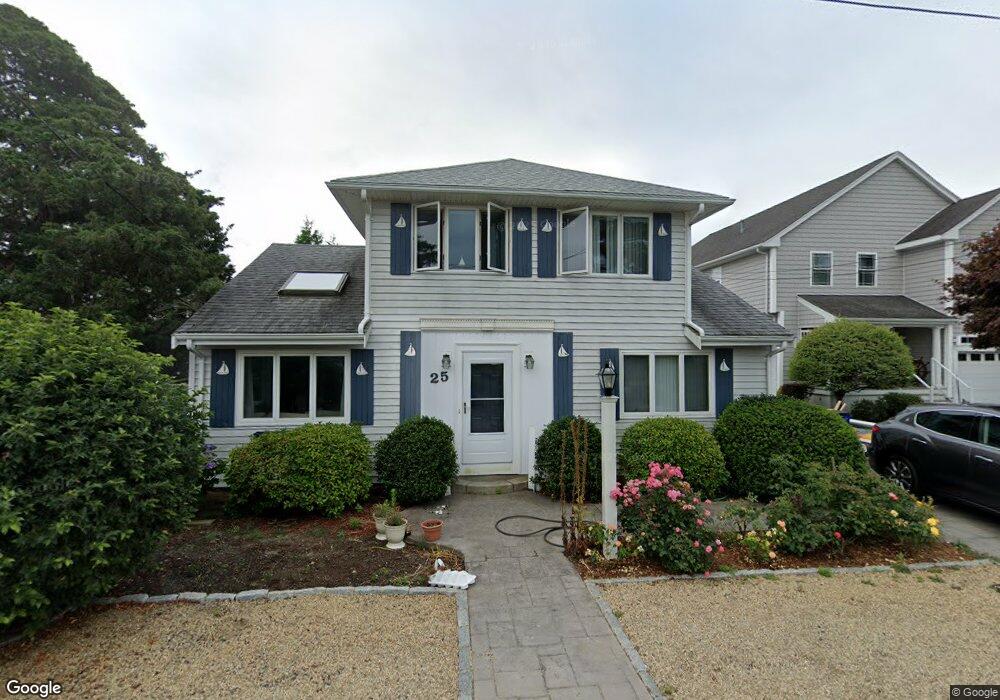
25 Kennebec Ave Pocasset, MA 02559
Pocasset NeighborhoodEstimated Value: $954,000 - $1,394,000
4
Beds
2
Baths
2,909
Sq Ft
$381/Sq Ft
Est. Value
About This Home
This home is located at 25 Kennebec Ave, Pocasset, MA 02559 and is currently estimated at $1,108,490, approximately $381 per square foot. 25 Kennebec Ave is a home located in Barnstable County with nearby schools including Bourne High School and Cadence Academy Preschool - Bourne.
Ownership History
Date
Name
Owned For
Owner Type
Purchase Details
Closed on
Feb 17, 2023
Sold by
Gary L Eaton 2021 Ret and Eaton
Bought by
Eaton Gary L
Current Estimated Value
Home Financials for this Owner
Home Financials are based on the most recent Mortgage that was taken out on this home.
Original Mortgage
$374,000
Outstanding Balance
$359,299
Interest Rate
5.25%
Mortgage Type
Adjustable Rate Mortgage/ARM
Estimated Equity
$749,191
Purchase Details
Closed on
Oct 21, 2021
Sold by
Eaton Gary L
Bought by
Gary L Eaton 2021 Ret and Eaton
Purchase Details
Closed on
May 8, 2019
Sold by
Eaton Nt and Eaton
Bought by
Eaton Gary L
Create a Home Valuation Report for This Property
The Home Valuation Report is an in-depth analysis detailing your home's value as well as a comparison with similar homes in the area
Home Values in the Area
Average Home Value in this Area
Purchase History
| Date | Buyer | Sale Price | Title Company |
|---|---|---|---|
| Eaton Gary L | -- | None Available | |
| Eaton Gary L | -- | None Available | |
| Eaton Gary L | -- | None Available | |
| Gary L Eaton 2021 Ret | -- | None Available | |
| Gary L Eaton 2021 Ret | -- | None Available | |
| Gary L Eaton 2021 Ret | -- | None Available | |
| Eaton Gary L | $540,000 | -- | |
| Eaton Gary L | $540,000 | -- | |
| Eaton Gary L | $540,000 | -- |
Source: Public Records
Mortgage History
| Date | Status | Borrower | Loan Amount |
|---|---|---|---|
| Open | Eaton Gary L | $374,000 | |
| Closed | Eaton Gary L | $374,000 |
Source: Public Records
Tax History Compared to Growth
Tax History
| Year | Tax Paid | Tax Assessment Tax Assessment Total Assessment is a certain percentage of the fair market value that is determined by local assessors to be the total taxable value of land and additions on the property. | Land | Improvement |
|---|---|---|---|---|
| 2025 | $7,028 | $899,900 | $508,700 | $391,200 |
| 2024 | $6,873 | $857,000 | $484,400 | $372,600 |
| 2023 | $6,682 | $758,400 | $428,700 | $329,700 |
| 2022 | $6,468 | $641,000 | $379,400 | $261,600 |
| 2021 | $6,284 | $583,500 | $345,300 | $238,200 |
| 2020 | $6,266 | $583,400 | $342,000 | $241,400 |
| 2019 | $5,989 | $569,800 | $342,000 | $227,800 |
| 2018 | $5,721 | $542,800 | $325,800 | $217,000 |
| 2017 | $5,253 | $510,000 | $322,700 | $187,300 |
| 2016 | $5,145 | $506,400 | $322,700 | $183,700 |
| 2015 | $4,883 | $484,900 | $301,200 | $183,700 |
Source: Public Records
Map
Nearby Homes
- 22 Nairn Rd
- 171 Bellavista Dr
- 89 Harbor Dr
- 34 Kenwood Rd
- 45 Kenwood Rd
- 48 Red Brook Harbor Rd
- 3 Red Brook Pond Dr
- 70 Wings Neck Rd
- 75 Winsor Rd
- 24 Richmond Rd
- 1094 County Rd
- 10 Squeteague Harbor Rd
- 254 Barlows Landing Rd
- 250 Scraggy Neck Rd
- 14 Navajo Rd
- 940 County Rd
- 940 County Rd
- 709 County Rd
- 461 Wings Neck Rd
- 27 Kennebec Ave
- 487 Circuit Ave
- 33 Kennebec Ave
- 15 Kennebec Ave
- 485 Circuit Ave
- 28 Kennebec Ave
- 491 Circuit Ave
- 22 Kennebec Ave
- 479 Circuit Ave
- 495 Circuit Ave
- 14 Kennebec Ave
- 469 Circuit Ave
- 475 Circuit Ave
- 497 Circuit Ave
- 509 Circuit Ave
- 19 Pequot Ave
- 8 Kennebec Ave
- 32 Kennebec Ave
- 515 Circuit Ave
- 463 Circuit Ave