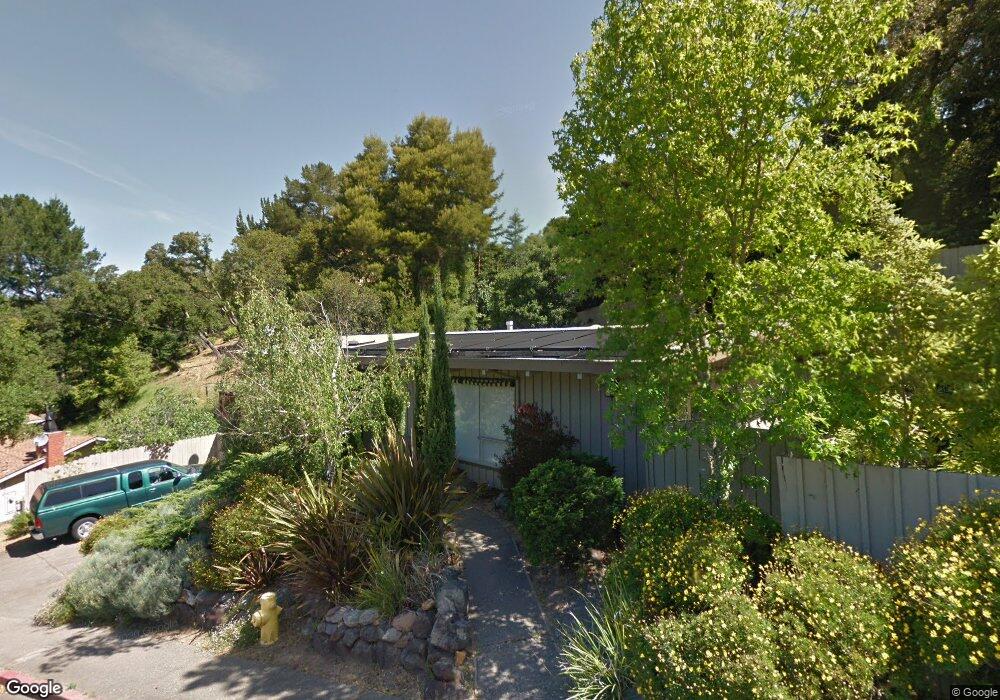
25 La Loma Ct San Rafael, CA 94901
Picnic Valley NeighborhoodEstimated Value: $1,226,000 - $1,328,872
4
Beds
2
Baths
1,846
Sq Ft
$688/Sq Ft
Est. Value
About This Home
This home is located at 25 La Loma Ct, San Rafael, CA 94901 and is currently estimated at $1,269,218, approximately $687 per square foot. 25 La Loma Ct is a home located in Marin County with nearby schools including Laurel Dell Elementary School, James B. Davidson Middle School, and San Rafael High School.
Ownership History
Date
Name
Owned For
Owner Type
Purchase Details
Closed on
Oct 7, 2015
Sold by
Daigle Ralph L and Chun Stephanie N
Bought by
Daigle Chun 2015 Trust and Chun Stephanie N
Current Estimated Value
Purchase Details
Closed on
Oct 26, 2001
Sold by
Willmann Hans A and Willmann Ann E
Bought by
Daigle Ralph L and Chun Stephanie N
Home Financials for this Owner
Home Financials are based on the most recent Mortgage that was taken out on this home.
Original Mortgage
$375,000
Outstanding Balance
$146,676
Interest Rate
6.73%
Estimated Equity
$1,122,542
Purchase Details
Closed on
Oct 13, 1998
Sold by
Juilly George E and Juilly Joann C
Bought by
Willmann Hans A and Willmann Ann E
Home Financials for this Owner
Home Financials are based on the most recent Mortgage that was taken out on this home.
Original Mortgage
$308,000
Interest Rate
6.79%
Create a Home Valuation Report for This Property
The Home Valuation Report is an in-depth analysis detailing your home's value as well as a comparison with similar homes in the area
Home Values in the Area
Average Home Value in this Area
Purchase History
| Date | Buyer | Sale Price | Title Company |
|---|---|---|---|
| Daigle Chun 2015 Trust | -- | None Available | |
| Daigle Ralph L | $575,000 | California Land Title | |
| Willmann Hans A | $385,000 | First American Title Co |
Source: Public Records
Mortgage History
| Date | Status | Borrower | Loan Amount |
|---|---|---|---|
| Open | Daigle Ralph L | $375,000 | |
| Previous Owner | Willmann Hans A | $308,000 | |
| Closed | Willmann Hans A | $38,500 |
Source: Public Records
Tax History Compared to Growth
Tax History
| Year | Tax Paid | Tax Assessment Tax Assessment Total Assessment is a certain percentage of the fair market value that is determined by local assessors to be the total taxable value of land and additions on the property. | Land | Improvement |
|---|---|---|---|---|
| 2025 | $12,086 | $844,957 | $559,260 | $285,697 |
| 2024 | $12,086 | $828,392 | $548,296 | $280,096 |
| 2023 | $11,865 | $812,154 | $537,548 | $274,606 |
| 2022 | $11,229 | $796,229 | $527,008 | $269,221 |
| 2021 | $11,050 | $780,619 | $516,676 | $263,943 |
| 2020 | $10,932 | $772,616 | $511,379 | $261,237 |
| 2019 | $10,533 | $757,470 | $501,354 | $256,116 |
| 2018 | $10,428 | $742,621 | $491,526 | $251,095 |
| 2017 | $10,037 | $728,063 | $481,890 | $246,173 |
| 2016 | $9,701 | $713,792 | $472,444 | $241,348 |
| 2015 | $9,272 | $703,073 | $465,350 | $237,723 |
| 2014 | $8,888 | $689,305 | $456,237 | $233,068 |
Source: Public Records
Map
Nearby Homes