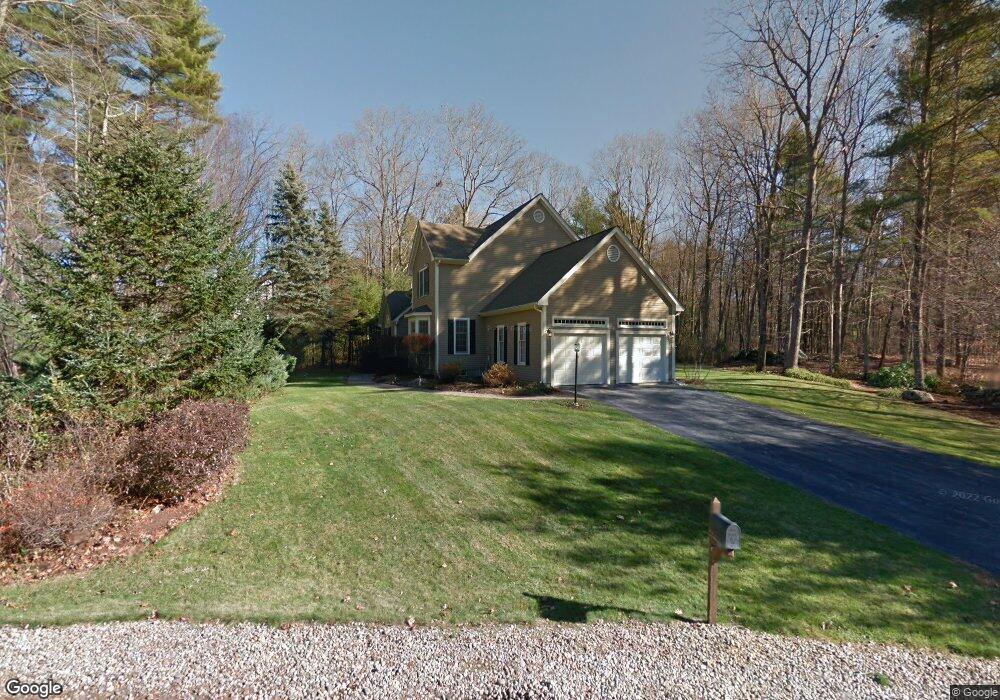
25 Lancaster Ln Bedford, NH 03110
Bedford NeighborhoodEstimated Value: $768,041 - $883,000
3
Beds
3
Baths
3,432
Sq Ft
$247/Sq Ft
Est. Value
About This Home
This home is located at 25 Lancaster Ln, Bedford, NH 03110 and is currently estimated at $847,760, approximately $247 per square foot. 25 Lancaster Ln is a home located in Hillsborough County with nearby schools including Mckelvie Intermediate School, Ross A. Lurgio Middle School, and Bedford High School.
Ownership History
Date
Name
Owned For
Owner Type
Purchase Details
Closed on
Nov 10, 2023
Sold by
Wydom Marc and Wydom Kristen
Bought by
Wydom Ft and Wydom
Current Estimated Value
Purchase Details
Closed on
Dec 28, 2011
Sold by
Judith B Meinhardt Ret and Hibbard
Bought by
Wydom Marc and Wydom Kristen
Home Financials for this Owner
Home Financials are based on the most recent Mortgage that was taken out on this home.
Original Mortgage
$291,465
Interest Rate
4%
Mortgage Type
Purchase Money Mortgage
Purchase Details
Closed on
Feb 24, 1997
Sold by
Delanty John T and Delanty Sharon E
Bought by
Meinhardt Richard L and Meinhardt Judith B
Home Financials for this Owner
Home Financials are based on the most recent Mortgage that was taken out on this home.
Original Mortgage
$228,000
Interest Rate
7.8%
Mortgage Type
Purchase Money Mortgage
Create a Home Valuation Report for This Property
The Home Valuation Report is an in-depth analysis detailing your home's value as well as a comparison with similar homes in the area
Home Values in the Area
Average Home Value in this Area
Purchase History
| Date | Buyer | Sale Price | Title Company |
|---|---|---|---|
| Wydom Ft | -- | None Available | |
| Wydom Marc | $342,900 | -- | |
| Meinhardt Richard L | $240,000 | -- |
Source: Public Records
Mortgage History
| Date | Status | Borrower | Loan Amount |
|---|---|---|---|
| Previous Owner | Meinhardt Richard L | $291,465 | |
| Previous Owner | Meinhardt Richard L | $228,000 |
Source: Public Records
Tax History Compared to Growth
Tax History
| Year | Tax Paid | Tax Assessment Tax Assessment Total Assessment is a certain percentage of the fair market value that is determined by local assessors to be the total taxable value of land and additions on the property. | Land | Improvement |
|---|---|---|---|---|
| 2024 | $10,748 | $679,800 | $261,800 | $418,000 |
| 2023 | $10,061 | $679,800 | $261,800 | $418,000 |
| 2022 | $9,349 | $531,200 | $193,900 | $337,300 |
| 2021 | $9,105 | $531,200 | $193,900 | $337,300 |
| 2020 | $9,147 | $456,900 | $155,100 | $301,800 |
| 2019 | $8,658 | $456,900 | $155,100 | $301,800 |
| 2018 | $8,584 | $420,800 | $155,100 | $265,700 |
| 2017 | $7,957 | $420,800 | $155,100 | $265,700 |
| 2016 | $7,812 | $349,200 | $124,100 | $225,100 |
| 2015 | $7,948 | $349,200 | $124,100 | $225,100 |
| 2014 | $7,857 | $349,200 | $124,100 | $225,100 |
| 2013 | $7,742 | $349,200 | $124,100 | $225,100 |
Source: Public Records
Map
Nearby Homes
- 32 Wellesley Dr
- 74 Settlers Ct
- 4 Westview Rd Unit Lot 4 - Hannah Floor
- 3 Westview Rd Unit Lot 3 - The Saffron
- 12 Mcintosh Ln
- 258 N Amherst Rd Unit 34
- 68 Perry Rd
- 301 N Amherst Rd
- 39 Mcintosh Ln
- 250 Joppa Hill Rd
- 28 Olde Lantern Rd
- 52 Hardy Rd
- 60 Riddle Dr
- 4 Jenkins Rd Unit Lot 31-4 - The Hann
- 20 Ledgewood Rd
- 3 Baldwin Ln
- 29 Ledgewood Rd
- 53 Essex Rd
- 9 Cherry Ln
- 101 Horace Greeley Rd
- 23 Lancaster Ln
- 27 Lancaster Ln
- 29 Lancaster Ln
- 21 Lancaster Ln
- 60 Catesby Ln
- 32 Lancaster Ln
- 19 Lancaster Ln
- 62 Catesby Ln
- 22 Lancaster Ln
- 17 Lancaster Ln
- 57 Catesby Ln
- 58 Catesby Ln
- 24 Lancaster Ln
- 20 Lancaster Ln
- 59 Catesby Ln
- 18 Lancaster Ln
- 56 Catesby Ln
- 15 Lancaster Ln
- 26 Lancaster Ln
- 54 Catesby Ln