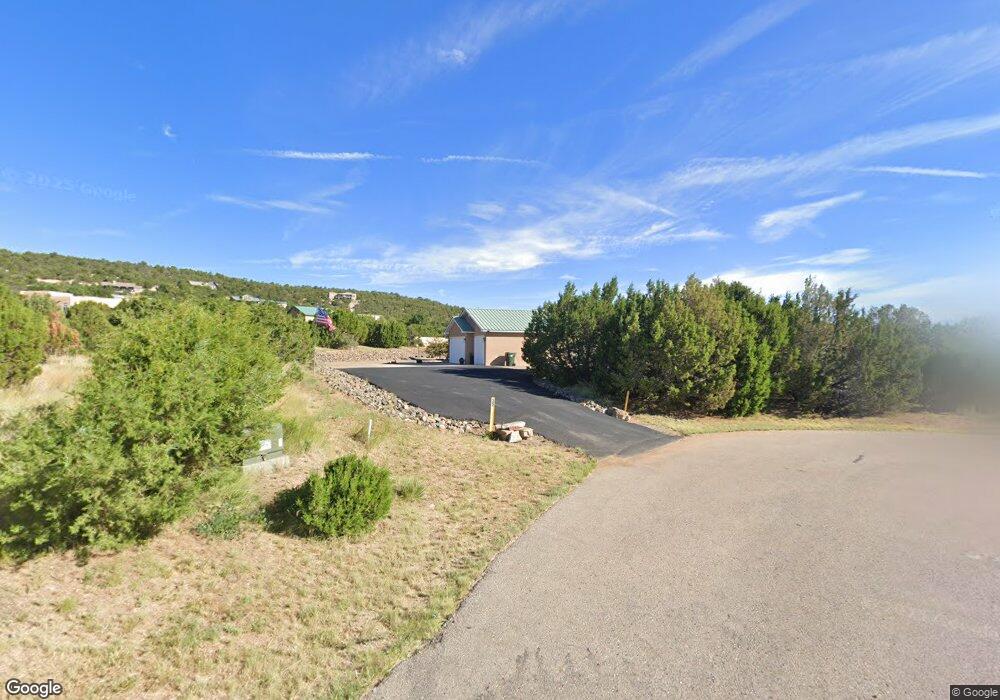
25 Lauren Taylor Ct Tijeras, NM 87059
Estimated Value: $665,443 - $772,000
3
Beds
3
Baths
3,086
Sq Ft
$225/Sq Ft
Est. Value
About This Home
This home is located at 25 Lauren Taylor Ct, Tijeras, NM 87059 and is currently estimated at $694,361, approximately $225 per square foot. 25 Lauren Taylor Ct is a home located in Bernalillo County with nearby schools including Route 66 Elementary School, Edgewood Middle School, and Moriarty High School.
Ownership History
Date
Name
Owned For
Owner Type
Purchase Details
Closed on
Apr 24, 2006
Sold by
Flying Elk Home Builders Llc
Bought by
Pohorence James and Pohorence Kathleen A
Current Estimated Value
Home Financials for this Owner
Home Financials are based on the most recent Mortgage that was taken out on this home.
Original Mortgage
$300,000
Outstanding Balance
$172,499
Interest Rate
6.37%
Mortgage Type
Purchase Money Mortgage
Estimated Equity
$521,862
Purchase Details
Closed on
Jun 23, 2005
Sold by
Petzel Joseph and Petzel Sheri
Bought by
Flying Elk Home Builders Llc
Home Financials for this Owner
Home Financials are based on the most recent Mortgage that was taken out on this home.
Original Mortgage
$520,000
Interest Rate
5.76%
Mortgage Type
Construction
Purchase Details
Closed on
Dec 14, 2004
Sold by
Smr 4 Llc
Bought by
Petzel Joseph and Petzel Sheri
Purchase Details
Closed on
Dec 26, 2003
Sold by
Heil Helga G and Holmberg Dorothy S
Bought by
Smr4 Llc
Create a Home Valuation Report for This Property
The Home Valuation Report is an in-depth analysis detailing your home's value as well as a comparison with similar homes in the area
Home Values in the Area
Average Home Value in this Area
Purchase History
| Date | Buyer | Sale Price | Title Company |
|---|---|---|---|
| Pohorence James | -- | Stewart Title | |
| Flying Elk Home Builders Llc | -- | Fidelity Natl Title Ins Co | |
| Petzel Joseph | -- | Fidelity National Title Insu | |
| Smr4 Llc | -- | Fidelity Natl Title Ins Co |
Source: Public Records
Mortgage History
| Date | Status | Borrower | Loan Amount |
|---|---|---|---|
| Open | Pohorence James | $300,000 | |
| Previous Owner | Flying Elk Home Builders Llc | $520,000 |
Source: Public Records
Tax History Compared to Growth
Tax History
| Year | Tax Paid | Tax Assessment Tax Assessment Total Assessment is a certain percentage of the fair market value that is determined by local assessors to be the total taxable value of land and additions on the property. | Land | Improvement |
|---|---|---|---|---|
| 2025 | $3,963 | $154,553 | $23,221 | $131,332 |
| 2024 | $3,963 | $150,052 | $22,545 | $127,507 |
| 2023 | $3,880 | $145,681 | $21,888 | $123,793 |
| 2022 | $3,745 | $141,439 | $21,251 | $120,188 |
| 2021 | $3,624 | $137,319 | $20,632 | $116,687 |
| 2020 | $3,546 | $133,320 | $20,031 | $113,289 |
| 2019 | $3,554 | $133,320 | $20,031 | $113,289 |
| 2018 | $3,478 | $133,320 | $20,031 | $113,289 |
| 2017 | $3,366 | $130,968 | $20,632 | $110,336 |
| 2016 | $3,367 | $126,711 | $20,632 | $106,079 |
| 2015 | $126,711 | $126,711 | $20,632 | $106,079 |
| 2014 | $3,477 | $126,711 | $20,632 | $106,079 |
| 2013 | -- | $123,021 | $20,031 | $102,990 |
Source: Public Records
Map
Nearby Homes
- 55 Western Saddle Dr
- 52 Sandia Mountain Ranch Dr
- 76 Sandia Mountain Ranch Dr
- 92 Sandia Mountain Ranch Dr
- 96 Sandia Mountain Ranch Dr
- 22 Sandia Mountain Ranch Dr
- 24 Anne Pickard Loop
- 714 Fleetfoot
- 119 Steeplechase Dr
- 685 Nm 217
- 8 Teypana Dr
- 3 Teypana Dr
- 44 Brannan Rd
- 21 Cresta Vista Ct
- 14 Teypana Dr
- 33 Valley Rd
- 40 Alta Vista Rd
- 36 Alta Vista Rd
- 13 Los Pecos Trail
- 370 Sedillo Rd
- 26 Lauren Taylor Ct
- 22 Lauren Taylor Ct
- 23 Lauren Taylor Ct
- 36 Western Saddle Dr
- 32 Western Saddle Dr
- 44 Western Saddle Dr
- 0 Western Saddle Ct
- 21 Naomi
- 21 Naomi Unit 4
- 20 Western Saddle Dr
- 35 Western Saddle Dr
- 2 Lauren Taylor Ct
- 62 Western Saddle Dr
- 24 Naomi
- 0 Lauren Taylor Ct
- 31 Western Saddle Dr
- 17 Naomi
- 7 Lauren Taylor Ct
- 0 Naomi Dr
- 0 Naomi Dr