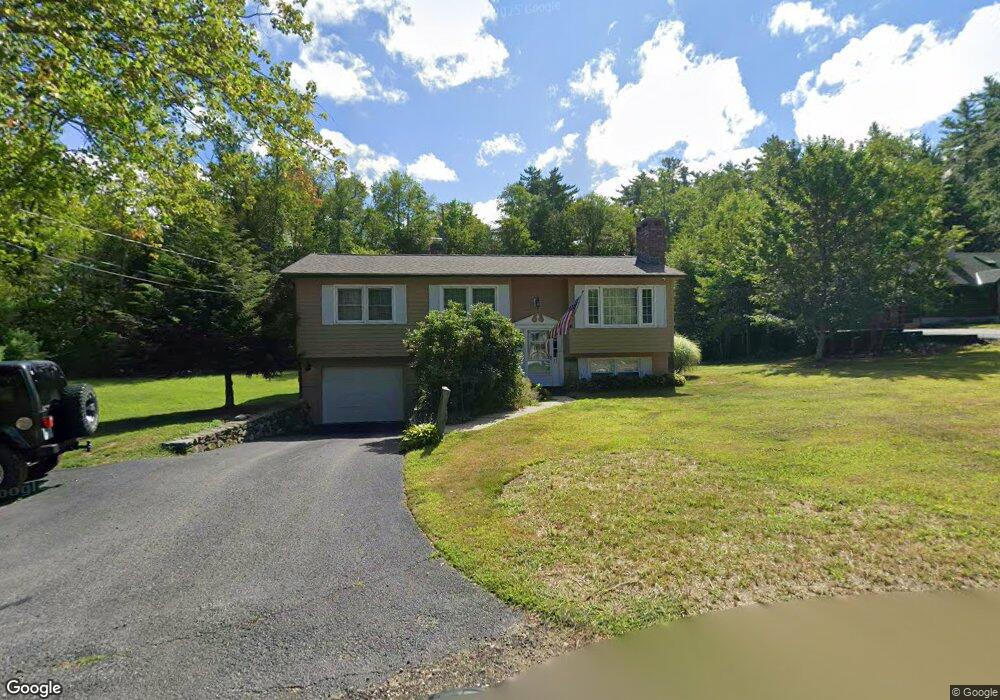
25 Libby Ct Jaffrey, NH 03452
Estimated Value: $346,000 - $446,000
3
Beds
2
Baths
992
Sq Ft
$397/Sq Ft
Est. Value
About This Home
This home is located at 25 Libby Ct, Jaffrey, NH 03452 and is currently estimated at $394,021, approximately $397 per square foot. 25 Libby Ct is a home located in Cheshire County with nearby schools including Jaffrey Grade School, Conant Middle High School, and Conant High School.
Ownership History
Date
Name
Owned For
Owner Type
Purchase Details
Closed on
Feb 27, 2025
Sold by
Moore James C and Moore Jeannelle F
Bought by
Nutile Paul M
Current Estimated Value
Home Financials for this Owner
Home Financials are based on the most recent Mortgage that was taken out on this home.
Original Mortgage
$370,217
Outstanding Balance
$367,758
Interest Rate
7.04%
Mortgage Type
FHA
Estimated Equity
$26,263
Purchase Details
Closed on
Jan 24, 2006
Sold by
Sirois Alice L
Bought by
Moore James C and Moore Jeannelle F
Create a Home Valuation Report for This Property
The Home Valuation Report is an in-depth analysis detailing your home's value as well as a comparison with similar homes in the area
Home Values in the Area
Average Home Value in this Area
Purchase History
| Date | Buyer | Sale Price | Title Company |
|---|---|---|---|
| Nutile Paul M | $383,000 | None Available | |
| Nutile Paul M | $383,000 | None Available | |
| Moore James C | $185,000 | -- |
Source: Public Records
Mortgage History
| Date | Status | Borrower | Loan Amount |
|---|---|---|---|
| Open | Nutile Paul M | $370,217 | |
| Closed | Nutile Paul M | $370,217 |
Source: Public Records
Tax History
| Year | Tax Paid | Tax Assessment Tax Assessment Total Assessment is a certain percentage of the fair market value that is determined by local assessors to be the total taxable value of land and additions on the property. | Land | Improvement |
|---|---|---|---|---|
| 2024 | $5,681 | $173,200 | $43,900 | $129,300 |
| 2023 | $5,776 | $173,200 | $43,900 | $129,300 |
| 2022 | $5,366 | $173,200 | $43,900 | $129,300 |
| 2021 | $4,831 | $173,200 | $43,900 | $129,300 |
| 2020 | $4,768 | $173,200 | $43,900 | $129,300 |
| 2019 | $4,688 | $134,600 | $35,100 | $99,500 |
| 2018 | $4,442 | $134,600 | $35,100 | $99,500 |
| 2017 | $4,438 | $134,600 | $35,100 | $99,500 |
| 2016 | $4,442 | $134,600 | $35,100 | $99,500 |
| 2015 | $4,471 | $134,600 | $35,100 | $99,500 |
| 2014 | $4,464 | $151,592 | $47,032 | $104,560 |
| 2013 | $4,411 | $151,592 | $47,032 | $104,560 |
Source: Public Records
Map
Nearby Homes
- 8 Charlonne St
- 40 Charlonne St
- 31 North St
- 8 Cross St
- 179 Scenic Dr
- 129 Scenic Dr
- 11 Saint Jean St
- 29 Hathorn Rd
- 98 Perry Rd
- 94 Fitch Rd
- 236 Main St
- 122 Proctor Rd
- 13 Harkness Rd
- 18 Roberts Dr Unit 1
- 65 Roberts Dr Unit 17
- 57 Roberts Dr Unit 19
- 199 Bryant Rd
- 52 Roberts Dr Unit 5
- 49 Roberts Dr Unit 23
- 40 Roberts Dr Unit 3