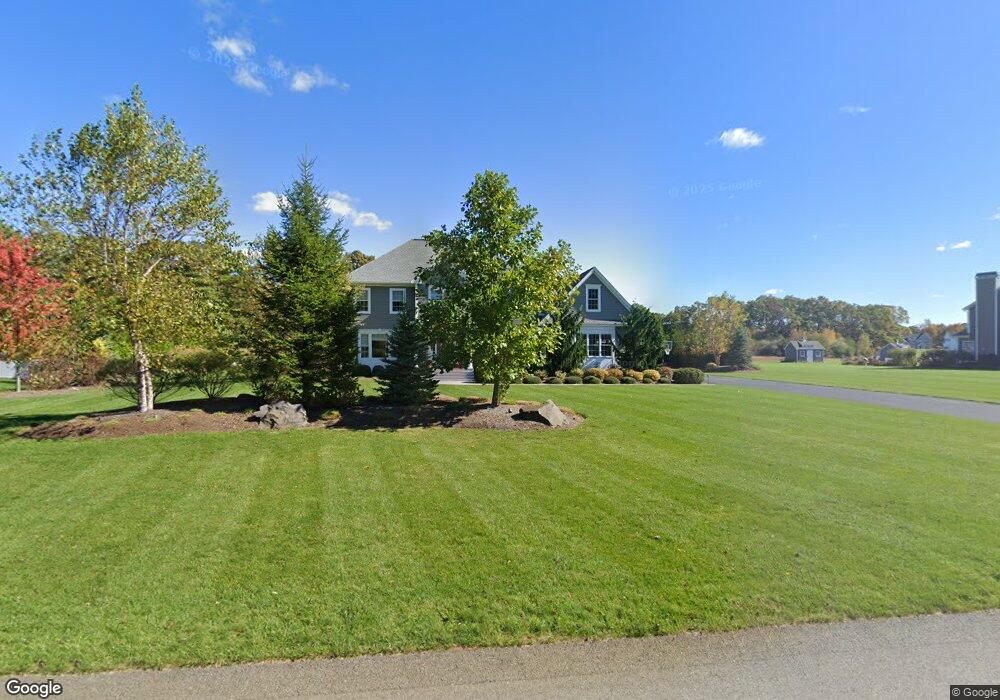
25 Linden Ln Rehoboth, MA 02769
Estimated Value: $928,000 - $1,005,000
4
Beds
3
Baths
2,856
Sq Ft
$340/Sq Ft
Est. Value
About This Home
This home is located at 25 Linden Ln, Rehoboth, MA 02769 and is currently estimated at $970,839, approximately $339 per square foot. 25 Linden Ln is a home with nearby schools including Dighton-Rehoboth Regional High School and Cedar Brook School.
Ownership History
Date
Name
Owned For
Owner Type
Purchase Details
Closed on
Apr 14, 2021
Sold by
Ferreira Const Co Inc
Bought by
Cunha Michael J and Cunha Rebecca
Current Estimated Value
Purchase Details
Closed on
Jun 28, 2016
Sold by
Ferreira Consruction C
Bought by
Cunha Michael J and Cunha Rebecca
Home Financials for this Owner
Home Financials are based on the most recent Mortgage that was taken out on this home.
Original Mortgage
$559,200
Interest Rate
3.57%
Mortgage Type
Unknown
Create a Home Valuation Report for This Property
The Home Valuation Report is an in-depth analysis detailing your home's value as well as a comparison with similar homes in the area
Home Values in the Area
Average Home Value in this Area
Purchase History
| Date | Buyer | Sale Price | Title Company |
|---|---|---|---|
| Cunha Michael J | -- | None Available | |
| Cunha Michael J | $185,000 | -- |
Source: Public Records
Mortgage History
| Date | Status | Borrower | Loan Amount |
|---|---|---|---|
| Previous Owner | Cunha Michael J | $559,200 |
Source: Public Records
Tax History Compared to Growth
Tax History
| Year | Tax Paid | Tax Assessment Tax Assessment Total Assessment is a certain percentage of the fair market value that is determined by local assessors to be the total taxable value of land and additions on the property. | Land | Improvement |
|---|---|---|---|---|
| 2025 | $101 | $906,000 | $204,200 | $701,800 |
| 2024 | $10,284 | $905,300 | $212,900 | $692,400 |
| 2023 | $9,548 | $824,500 | $208,500 | $616,000 |
| 2022 | $9,304 | $734,300 | $191,600 | $542,700 |
| 2021 | $9,148 | $690,900 | $175,000 | $515,900 |
| 2020 | $9,107 | $694,100 | $178,200 | $515,900 |
| 2018 | $3,323 | $277,600 | $157,600 | $120,000 |
| 2017 | $2,066 | $164,500 | $164,500 | $0 |
| 2016 | $2,083 | $171,400 | $171,400 | $0 |
| 2015 | $2,014 | $163,600 | $163,600 | $0 |
Source: Public Records
Map
Nearby Homes