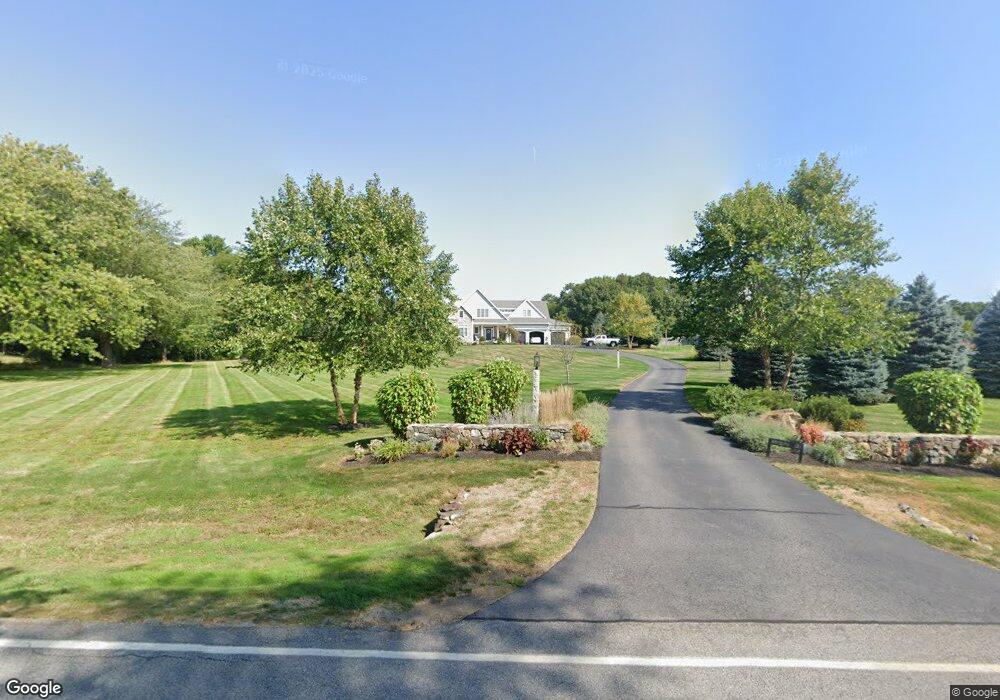
25 Maple Rd Unit 4 North Hampton, NH 03862
Estimated Value: $1,826,517 - $2,367,000
4
Beds
4
Baths
3,257
Sq Ft
$649/Sq Ft
Est. Value
About This Home
This home is located at 25 Maple Rd Unit 4, North Hampton, NH 03862 and is currently estimated at $2,113,629, approximately $648 per square foot. 25 Maple Rd Unit 4 is a home located in Rockingham County with nearby schools including North Hampton School, Winnacunnet High School, and Squamscott River Academy.
Ownership History
Date
Name
Owned For
Owner Type
Purchase Details
Closed on
Oct 5, 2022
Sold by
Miolla Ft and Miolla
Bought by
Bradley A Chartier Ret and Chartier
Current Estimated Value
Purchase Details
Closed on
Apr 15, 2022
Sold by
Miolla Raymond L and Miolla Cristine M
Bought by
Miolla Ft
Purchase Details
Closed on
Aug 17, 2018
Sold by
Craig A Chartier 1998
Bought by
Miolla Raymond L and Miolla Christine M
Home Financials for this Owner
Home Financials are based on the most recent Mortgage that was taken out on this home.
Original Mortgage
$944,000
Interest Rate
4.5%
Mortgage Type
Purchase Money Mortgage
Purchase Details
Closed on
Feb 21, 2018
Sold by
Persimmon Homes Llc
Bought by
Craig A Chartier 1998
Create a Home Valuation Report for This Property
The Home Valuation Report is an in-depth analysis detailing your home's value as well as a comparison with similar homes in the area
Home Values in the Area
Average Home Value in this Area
Purchase History
| Date | Buyer | Sale Price | Title Company |
|---|---|---|---|
| Bradley A Chartier Ret | $1,801,000 | None Available | |
| Miolla Ft | -- | None Available | |
| Miolla Raymond L | $1,210,000 | -- | |
| Craig A Chartier 1998 | $1,180,000 | -- |
Source: Public Records
Mortgage History
| Date | Status | Borrower | Loan Amount |
|---|---|---|---|
| Previous Owner | Miolla Raymond L | $944,000 |
Source: Public Records
Tax History
| Year | Tax Paid | Tax Assessment Tax Assessment Total Assessment is a certain percentage of the fair market value that is determined by local assessors to be the total taxable value of land and additions on the property. | Land | Improvement |
|---|---|---|---|---|
| 2024 | $20,102 | $1,570,500 | $439,500 | $1,131,000 |
| 2023 | $19,500 | $1,566,300 | $439,500 | $1,126,800 |
| 2022 | $17,149 | $998,800 | $231,500 | $767,300 |
| 2021 | $16,550 | $998,800 | $231,500 | $767,300 |
| 2020 | $16,890 | $998,800 | $231,500 | $767,300 |
| 2019 | $19,567 | $1,171,700 | $231,500 | $940,200 |
| 2018 | $10,170 | $1,171,700 | $231,500 | $940,200 |
| 2017 | $3,881 | $209,800 | $209,800 | $0 |
| 2016 | $3,732 | $209,800 | $209,800 | $0 |
| 2015 | $16 | $900 | $900 | $0 |
| 2014 | $15 | $900 | $900 | $0 |
| 2013 | $15 | $900 | $900 | $0 |
Source: Public Records
Map
Nearby Homes
- 12 Runnymede Dr
- 2 Willowbrook Ave
- 1 Fairway Dr
- 193 Mill Rd
- 495 South Rd
- 78 South Rd
- 43 Ancient Hwy
- 12 Smith Ave
- 61 Acorn Rd
- 30 Ancient Hwy
- 38 Mill Rd
- 947 Ocean Blvd Unit 17
- 939 Ocean Blvd Unit 14
- 190 Kings Hwy Unit A1
- 467 High St Unit 10
- 11 Pine St
- 415 High St Unit 3
- 11 Lamson Ln
- 36 Seabreeze Dr
- 53 Seabreeze Dr
Your Personal Tour Guide
Ask me questions while you tour the home.