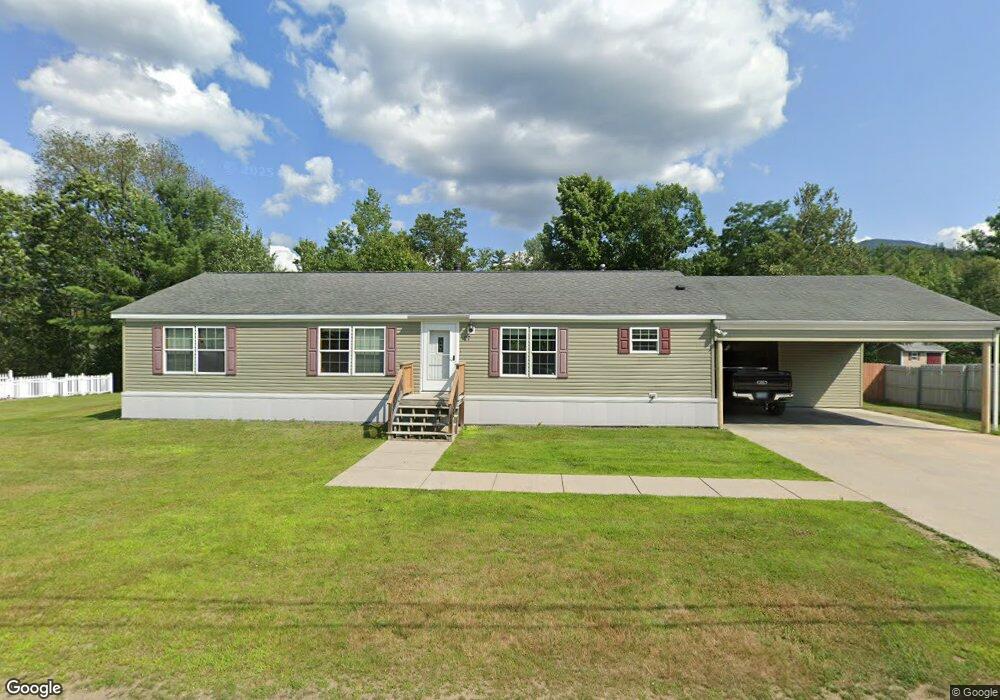
25 Mill St Gorham, NH 03581
Estimated Value: $250,000 - $482,000
4
Beds
2
Baths
1,823
Sq Ft
$196/Sq Ft
Est. Value
About This Home
This home is located at 25 Mill St, Gorham, NH 03581 and is currently estimated at $357,820, approximately $196 per square foot. 25 Mill St is a home located in Coos County with nearby schools including Edward Fenn Elementary School, Gorham Middle School, and Gorham High School.
Ownership History
Date
Name
Owned For
Owner Type
Purchase Details
Closed on
May 8, 2024
Sold by
Schoenbeck Joy V
Bought by
Joy V Schoenbeck Ret and Schoenbeck
Current Estimated Value
Purchase Details
Closed on
Sep 26, 2016
Sold by
Schoenbeck Paul C
Bought by
Schoenbeck Joy V
Purchase Details
Closed on
Aug 22, 2011
Sold by
Mark D Taillon Ret
Bought by
Schoenbeck Joy V and Schoenbeck Paul C
Home Financials for this Owner
Home Financials are based on the most recent Mortgage that was taken out on this home.
Original Mortgage
$140,000
Interest Rate
4.62%
Mortgage Type
Purchase Money Mortgage
Create a Home Valuation Report for This Property
The Home Valuation Report is an in-depth analysis detailing your home's value as well as a comparison with similar homes in the area
Home Values in the Area
Average Home Value in this Area
Purchase History
| Date | Buyer | Sale Price | Title Company |
|---|---|---|---|
| Joy V Schoenbeck Ret | -- | None Available | |
| Joy V Schoenbeck Ret | -- | None Available | |
| Schoenbeck Joy V | -- | -- | |
| Schoenbeck Joy V | $175,000 | -- | |
| Schoenbeck Joy V | -- | -- | |
| Schoenbeck Joy V | $175,000 | -- |
Source: Public Records
Mortgage History
| Date | Status | Borrower | Loan Amount |
|---|---|---|---|
| Previous Owner | Schoenbeck Joy V | $140,000 | |
| Previous Owner | Schoenbeck Joy V | $100,000 |
Source: Public Records
Tax History
| Year | Tax Paid | Tax Assessment Tax Assessment Total Assessment is a certain percentage of the fair market value that is determined by local assessors to be the total taxable value of land and additions on the property. | Land | Improvement |
|---|---|---|---|---|
| 2024 | $8,077 | $285,500 | $37,300 | $248,200 |
| 2023 | $7,009 | $285,500 | $37,300 | $248,200 |
| 2022 | $6,923 | $285,500 | $37,300 | $248,200 |
| 2021 | $6,298 | $176,900 | $19,900 | $157,000 |
| 2020 | $5,634 | $176,900 | $19,900 | $157,000 |
| 2019 | $5,974 | $176,900 | $19,900 | $157,000 |
| 2018 | $6,459 | $176,900 | $19,900 | $157,000 |
| 2017 | $6,006 | $176,900 | $19,900 | $157,000 |
| 2014 | $4,584 | $149,400 | $30,200 | $119,200 |
| 2010 | $4,249 | $177,400 | $28,600 | $148,800 |
Source: Public Records
Map
Nearby Homes
Your Personal Tour Guide
Ask me questions while you tour the home.