Estimated Value: $743,000 - $908,000
3
Beds
2
Baths
2,727
Sq Ft
$310/Sq Ft
Est. Value
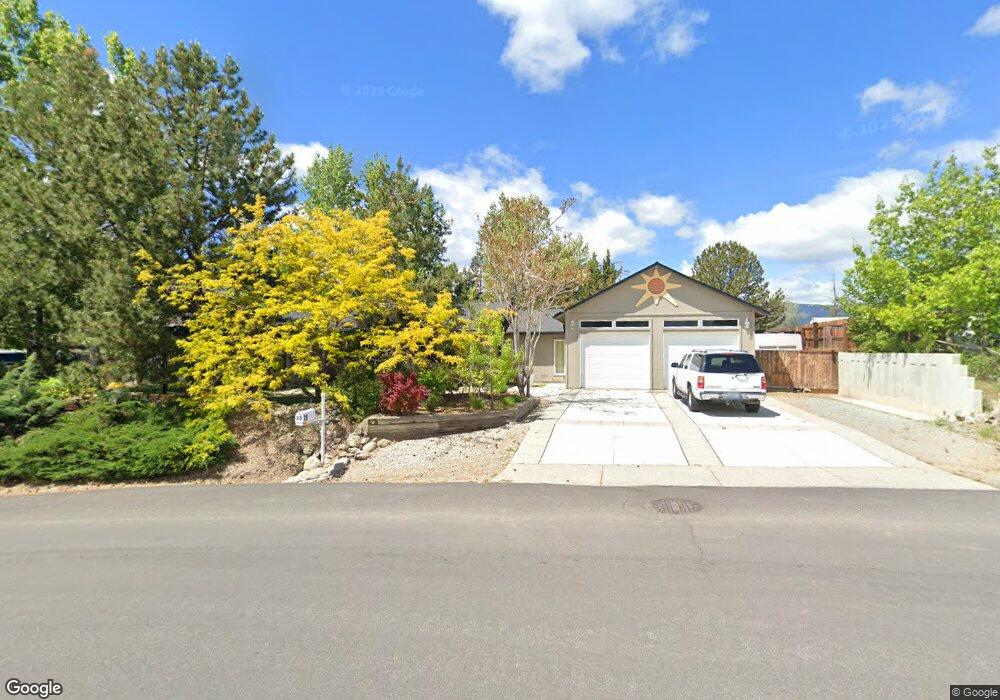
About This Home
This home is located at 25 Mogul Mountain Dr, Reno, NV 89523 and is currently estimated at $845,969, approximately $310 per square foot. 25 Mogul Mountain Dr is a home located in Washoe County with nearby schools including Verdi Elementary School, B D Billinghurst Middle School, and Robert McQueen High School.
Ownership History
Date
Name
Owned For
Owner Type
Purchase Details
Closed on
Sep 12, 2023
Sold by
Jameson Jeffrey G and Jameson Cheryl L
Bought by
Jeffrey And Cheryl Jameson Family Trust and Jameson
Current Estimated Value
Purchase Details
Closed on
Apr 6, 1998
Sold by
Jameson Cheryl L and Burchick Cheryl L
Bought by
Jameson Jeffrey G and Jameson Cheryl L
Home Financials for this Owner
Home Financials are based on the most recent Mortgage that was taken out on this home.
Original Mortgage
$15,500
Interest Rate
7.07%
Purchase Details
Closed on
Jul 25, 1994
Sold by
Burchick Cheryl L
Bought by
Burchick Cheryl L
Home Financials for this Owner
Home Financials are based on the most recent Mortgage that was taken out on this home.
Original Mortgage
$101,000
Interest Rate
8.38%
Create a Home Valuation Report for This Property
The Home Valuation Report is an in-depth analysis detailing your home's value as well as a comparison with similar homes in the area
Home Values in the Area
Average Home Value in this Area
Purchase History
| Date | Buyer | Sale Price | Title Company |
|---|---|---|---|
| Jeffrey And Cheryl Jameson Family Trust | -- | None Listed On Document | |
| Jameson Jeffrey G | -- | First American Title Co | |
| Burchick Cheryl L | -- | First American Title Company |
Source: Public Records
Mortgage History
| Date | Status | Borrower | Loan Amount |
|---|---|---|---|
| Previous Owner | Jameson Jeffrey G | $15,500 | |
| Previous Owner | Burchick Cheryl L | $101,000 |
Source: Public Records
Tax History Compared to Growth
Tax History
| Year | Tax Paid | Tax Assessment Tax Assessment Total Assessment is a certain percentage of the fair market value that is determined by local assessors to be the total taxable value of land and additions on the property. | Land | Improvement |
|---|---|---|---|---|
| 2025 | $2,898 | $133,587 | $56,840 | $76,747 |
| 2024 | $2,898 | $132,090 | $54,250 | $77,840 |
| 2023 | $2,817 | $126,940 | $52,675 | $74,265 |
| 2022 | $2,735 | $105,237 | $43,085 | $62,152 |
| 2021 | $2,657 | $94,271 | $32,270 | $62,001 |
| 2020 | $2,577 | $94,329 | $31,500 | $62,829 |
| 2019 | $2,505 | $90,175 | $29,050 | $61,125 |
| 2018 | $2,428 | $82,636 | $22,365 | $60,271 |
| 2017 | $2,359 | $80,656 | $19,775 | $60,881 |
| 2016 | $2,296 | $81,277 | $18,725 | $62,552 |
| 2015 | $2,292 | $80,436 | $17,535 | $62,901 |
| 2014 | $2,228 | $74,887 | $14,245 | $60,642 |
| 2013 | -- | $71,718 | $11,830 | $59,888 |
Source: Public Records
Map
Nearby Homes
- 0 Mountain Daisy Rd
- 0 Mountain Haven Ln
- 828 Larrimore Trail
- 80 Bobcat Dr
- 1014 Herndon Trail
- 9225 Sassafras Trail
- 270 Mogul Mountain Dr
- 1124 Dutch Hollow Trail
- 3380 Mario Rd
- 1335 Wakefield Trail
- 1380 Wakefield Trail
- 20 Eagle Claw Ct
- 1170 Cliff Park Way
- 150 Mule Deer Dr
- 1266 Firefly Ct
- 1395 Walking Stick Way
- 1405 Meridian Ranch Dr
- 285 Lemming Dr
- 605 Deer Mountain Rd
- 480 Gooseberry Dr
- 35 Mogul Mountain Dr
- 15 Mogul Mountain Dr
- 10 Mogul Mountain Cir
- 45 Mogul Mountain Dr
- 920 Broadridge Ct
- 30 Mogul Mountain Dr
- 920 Broderick Trail Unit 5715 Alpine 3car
- 20 Mogul Mountain Cir
- 5 Mogul Mountain Dr
- 55 Mogul Mountain Dr
- 15 Mogul Mountain Cir
- 10 Mogul Mountain Dr
- 930 Broderick Trail
- 65 Mogul Mountain Dr
- 30 Mogul Mountain Cir
- 40 Mogul Mountain Dr
- 930 Broadridge Ct
- 210 Mountain Ridge Rd
- 25 Mogul Mountain Cir
- 10585 Silva Ranch Rd Unit 1