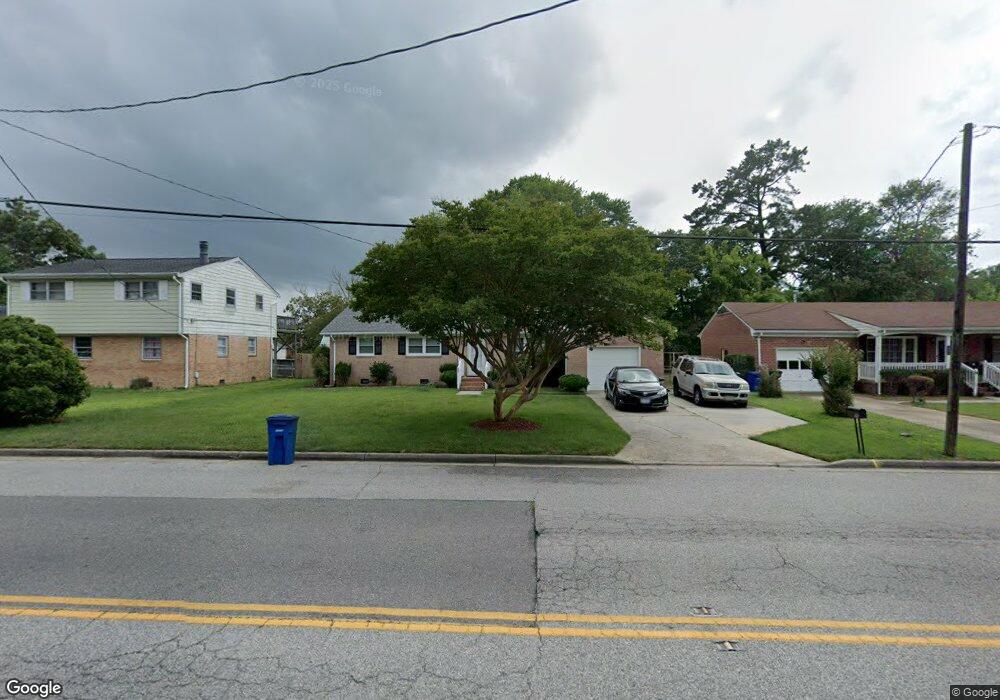
25 Moyer Rd Newport News, VA 23608
Nelson NeighborhoodEstimated Value: $269,000 - $316,000
3
Beds
2
Baths
1,300
Sq Ft
$228/Sq Ft
Est. Value
About This Home
This home is located at 25 Moyer Rd, Newport News, VA 23608 and is currently estimated at $296,134, approximately $227 per square foot. 25 Moyer Rd is a home located in Newport News City with nearby schools including Knollwood Meadows Elementary School, Mary Passage Middle School, and Denbigh High School.
Ownership History
Date
Name
Owned For
Owner Type
Purchase Details
Closed on
Nov 6, 2020
Sold by
Grisham Clint J and Grisham Katelyn A
Bought by
Morris Gregory D and Morris Gail
Current Estimated Value
Home Financials for this Owner
Home Financials are based on the most recent Mortgage that was taken out on this home.
Original Mortgage
$196,377
Outstanding Balance
$174,348
Interest Rate
2.8%
Mortgage Type
FHA
Estimated Equity
$121,786
Purchase Details
Closed on
Feb 28, 2017
Sold by
Autry Jeremy P and Mclean Monique K
Bought by
Grisham Katelyn A and Grisham Clint J
Home Financials for this Owner
Home Financials are based on the most recent Mortgage that was taken out on this home.
Original Mortgage
$169,569
Interest Rate
4.09%
Mortgage Type
VA
Purchase Details
Closed on
Aug 29, 2007
Sold by
Griffin Alicia
Bought by
Autry Jeremy P
Home Financials for this Owner
Home Financials are based on the most recent Mortgage that was taken out on this home.
Original Mortgage
$205,900
Interest Rate
6.71%
Mortgage Type
New Conventional
Create a Home Valuation Report for This Property
The Home Valuation Report is an in-depth analysis detailing your home's value as well as a comparison with similar homes in the area
Home Values in the Area
Average Home Value in this Area
Purchase History
| Date | Buyer | Sale Price | Title Company |
|---|---|---|---|
| Morris Gregory D | $200,000 | Viking Title & Escrow Llc | |
| Grisham Katelyn A | $166,000 | Attorney | |
| Autry Jeremy P | $205,900 | -- |
Source: Public Records
Mortgage History
| Date | Status | Borrower | Loan Amount |
|---|---|---|---|
| Open | Morris Gregory D | $196,377 | |
| Previous Owner | Grisham Katelyn A | $169,569 | |
| Previous Owner | Autry Jeremy P | $205,900 |
Source: Public Records
Tax History Compared to Growth
Tax History
| Year | Tax Paid | Tax Assessment Tax Assessment Total Assessment is a certain percentage of the fair market value that is determined by local assessors to be the total taxable value of land and additions on the property. | Land | Improvement |
|---|---|---|---|---|
| 2025 | $3,385 | $284,300 | $75,900 | $208,400 |
| 2024 | $3,238 | $274,400 | $75,900 | $198,500 |
| 2023 | $3,211 | $259,700 | $75,900 | $183,800 |
| 2022 | $3,033 | $240,500 | $75,900 | $164,600 |
| 2021 | $2,472 | $202,600 | $69,000 | $133,600 |
| 2020 | $2,233 | $171,000 | $69,000 | $102,000 |
| 2019 | $2,228 | $171,000 | $69,000 | $102,000 |
| 2018 | $2,178 | $167,100 | $69,000 | $98,100 |
| 2017 | $2,142 | $164,200 | $69,000 | $95,200 |
| 2016 | $2,138 | $164,200 | $69,000 | $95,200 |
| 2015 | $2,132 | $164,200 | $69,000 | $95,200 |
| 2014 | $1,917 | $164,200 | $69,000 | $95,200 |
Source: Public Records
Map
Nearby Homes
- 865 Wilmont Ln
- 862 Moyer Rd
- 702 Lipton Dr
- 51 Deer Run Trail
- 207 Ford Ct
- 74 Knollwood Dr
- 19 Evelyn Dr
- 863 Catalina Dr
- 877 Monarda Ct
- 803 Ashley Place
- 832 Garrow Rd
- 840 Garrow Rd
- 131 Denbigh Blvd
- 117 Virginia Dr
- 882 Catalina Dr
- 72 Springdale Dr
- 783 Childress Dr
- 158 Highwood Cir
- 104 King Forest Ln
- 917 Lacon Dr