
Seller's Agent in 2023
Angela Wilson
Gerrard-Hoeschler
(608) 769-7208
227 in this area
478 Total Sales

Estimated Value: $298,121 - $315,000
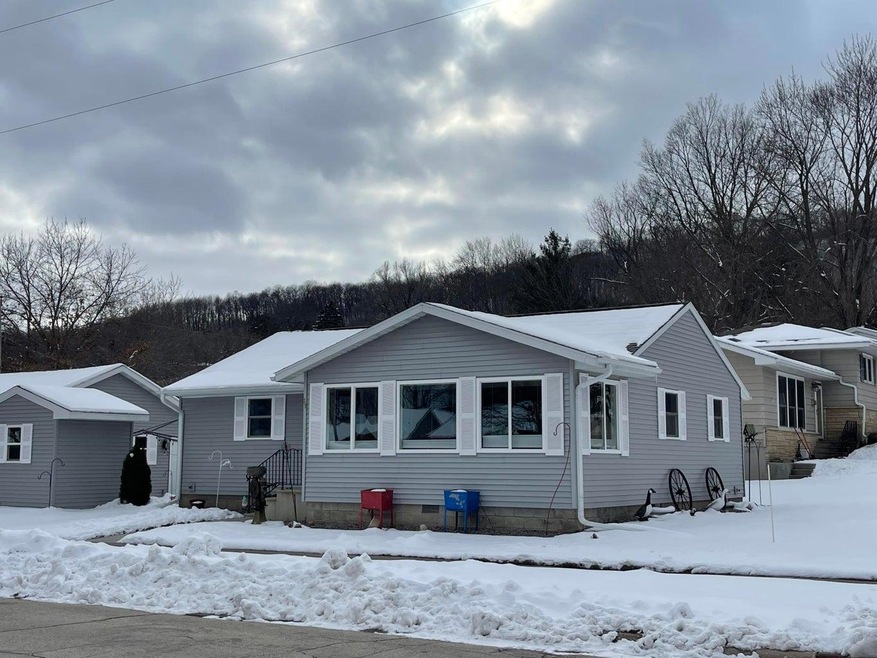
Beautiful home has been completely updated. Main floor open concept will an abundance of natural light coming in the large windows. 4 bedrooms, 2 full baths that both have double sinks, and a detached 2+ car garage. Luxury vinyl floors, contemporary painted walls with white trim and doors. Lower level have another family room, 4th bedroom and 2nd bathroom. Relaxing stamped concrete patio and parking pad for extra parking. Nice corner lot and close to downtown. Shed and kitchen appliances are included.
| Date | Buyer | Sale Price | Title Company |
|---|---|---|---|
| Pelowski Scott A | $315,000 | None Listed On Document | |
| Pelowski Scptt | $315,000 | -- | |
| Storlie Judith | $245,000 | None Available | |
| Radecki John | $93,000 | None Available | |
| Mcnally Properties Llc | $70,000 | None Available |
| Date | Status | Borrower | Loan Amount |
|---|---|---|---|
| Previous Owner | Storlie Judith | $196,000 |
| Date | Event | Price | List to Sale | Price per Sq Ft |
|---|---|---|---|---|
| 04/14/2023 04/14/23 | Sold | $315,000 | 0.0% | $141 / Sq Ft |
| 03/15/2023 03/15/23 | Pending | -- | -- | -- |
| 03/11/2023 03/11/23 | For Sale | $315,000 | -- | $141 / Sq Ft |
| Year | Tax Paid | Tax Assessment Tax Assessment Total Assessment is a certain percentage of the fair market value that is determined by local assessors to be the total taxable value of land and additions on the property. | Land | Improvement |
|---|---|---|---|---|
| 2025 | $3,398 | $279,000 | $32,500 | $246,500 |
| 2024 | $2,642 | $252,400 | $32,500 | $219,900 |
| 2023 | $2,634 | $190,800 | $22,500 | $168,300 |
| 2022 | $2,224 | $190,800 | $22,500 | $168,300 |
| 2021 | $1,958 | $144,100 | $22,500 | $121,600 |
| 2020 | $1,960 | $131,000 | $22,500 | $108,500 |
| 2019 | $3,482 | $131,000 | $22,500 | $108,500 |
| 2018 | $1,504 | $117,500 | $22,500 | $95,000 |
| 2017 | $1,504 | $81,900 | $16,934 | $64,966 |
| 2016 | $1,308 | $109,300 | $22,600 | $86,700 |
| 2015 | $1,236 | $103,600 | $21,400 | $82,200 |
| 2014 | $1,236 | $76,100 | $15,659 | $60,441 |
Seller's Agent in 2023
Angela Wilson
Gerrard-Hoeschler
(608) 769-7208
227 in this area
478 Total Sales
A
Buyer's Agent in 2023
Allison Benish
Edina Realty, Inc.
(608) 797-9918
11 in this area
20 Total Sales
Source: NorthstarMLS
MLS Number: 6342479
APN: R-25.0281.000
Disclaimer: Certain information contained herein is derived from information provided by parties other than Homes.com. All information provided is deemed reliable, but is not guaranteed to be accurate and should be independently verified.
![]() Based on information submitted to the MLS GRID. All data is obtained from various sources and may not have been verified by broker or MLS GRID. Supplied Open House Information is subject to change without notice. All information should be independently reviewed and verified for accuracy. Properties may or may not be listed by the office/agent presenting the information. Some IDX listings have been excluded from this website.
Based on information submitted to the MLS GRID. All data is obtained from various sources and may not have been verified by broker or MLS GRID. Supplied Open House Information is subject to change without notice. All information should be independently reviewed and verified for accuracy. Properties may or may not be listed by the office/agent presenting the information. Some IDX listings have been excluded from this website.
Based on information submitted to the MLS GRID
Ask me questions while you tour the home.