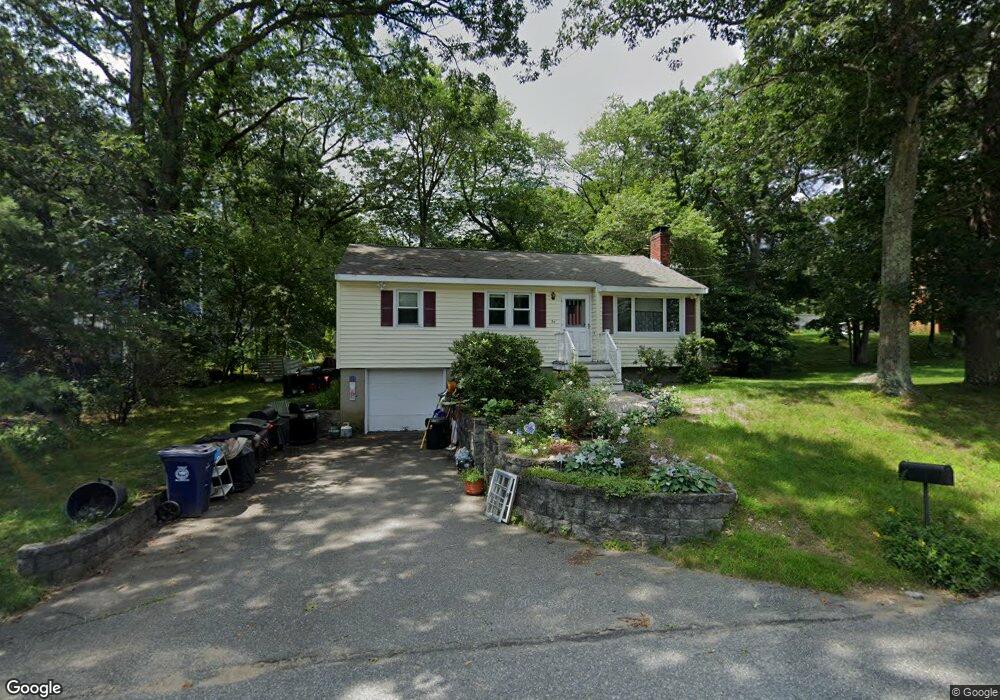
25 Nassau Ave Wilmington, MA 01887
Estimated Value: $581,945 - $687,000
3
Beds
1
Bath
1,089
Sq Ft
$587/Sq Ft
Est. Value
About This Home
This home is located at 25 Nassau Ave, Wilmington, MA 01887 and is currently estimated at $638,986, approximately $586 per square foot. 25 Nassau Ave is a home located in Middlesex County with nearby schools including Wilmington Middle School, Wilmington High School, and Abundant Life Christian School and Childcare.
Ownership History
Date
Name
Owned For
Owner Type
Purchase Details
Closed on
Apr 30, 2009
Sold by
Langone Richard D and Langone Darlene J
Bought by
Gorski Chris
Current Estimated Value
Home Financials for this Owner
Home Financials are based on the most recent Mortgage that was taken out on this home.
Original Mortgage
$253,000
Outstanding Balance
$159,937
Interest Rate
4.86%
Estimated Equity
$479,049
Purchase Details
Closed on
Mar 17, 2006
Sold by
Rock Rt
Bought by
Langone Darlene J
Home Financials for this Owner
Home Financials are based on the most recent Mortgage that was taken out on this home.
Original Mortgage
$260,720
Interest Rate
6.27%
Mortgage Type
Purchase Money Mortgage
Purchase Details
Closed on
Oct 28, 2005
Sold by
Stevenson James A
Bought by
Rock Rt
Create a Home Valuation Report for This Property
The Home Valuation Report is an in-depth analysis detailing your home's value as well as a comparison with similar homes in the area
Home Values in the Area
Average Home Value in this Area
Purchase History
| Date | Buyer | Sale Price | Title Company |
|---|---|---|---|
| Gorski Chris | $303,000 | -- | |
| Langone Darlene J | $325,900 | -- | |
| Rock Rt | $230,000 | -- |
Source: Public Records
Mortgage History
| Date | Status | Borrower | Loan Amount |
|---|---|---|---|
| Open | Gorski Chris | $253,000 | |
| Previous Owner | Langone Darlene J | $260,720 |
Source: Public Records
Tax History Compared to Growth
Tax History
| Year | Tax Paid | Tax Assessment Tax Assessment Total Assessment is a certain percentage of the fair market value that is determined by local assessors to be the total taxable value of land and additions on the property. | Land | Improvement |
|---|---|---|---|---|
| 2025 | $5,616 | $490,500 | $260,800 | $229,700 |
| 2024 | $5,401 | $472,500 | $260,800 | $211,700 |
| 2023 | $5,232 | $438,200 | $237,100 | $201,100 |
| 2022 | $4,961 | $380,700 | $197,600 | $183,100 |
| 2021 | $4,916 | $355,200 | $179,600 | $175,600 |
| 2020 | $4,616 | $339,900 | $179,600 | $160,300 |
| 2019 | $4,527 | $329,200 | $171,000 | $158,200 |
| 2018 | $4,206 | $291,900 | $162,900 | $129,000 |
| 2017 | $3,971 | $274,800 | $155,100 | $119,700 |
| 2016 | $3,914 | $267,500 | $147,800 | $119,700 |
| 2015 | $3,702 | $257,600 | $147,800 | $109,800 |
| 2014 | $3,440 | $241,600 | $140,700 | $100,900 |
Source: Public Records
Map
Nearby Homes
- 48 Brand Ave
- 142 Burlington Ave
- 8 Cushing Dr
- 14 Roberts Rd
- 15 Forest St
- 56 Grove Ave
- 3 Cochrane Rd
- 11 Patchs Pond Ln
- 27 Fairview Ave
- 151 Grove Ave
- 2 Winston Ave
- 17 Lake St
- 114 Lake St
- 20 Hopkins St
- 9 Parker St
- 54 Lakeview Ave
- 3 Sarafina's Way
- 7 Cross St Unit 306
- 7 Cross St Unit 304
- 7 Cross St Unit 205