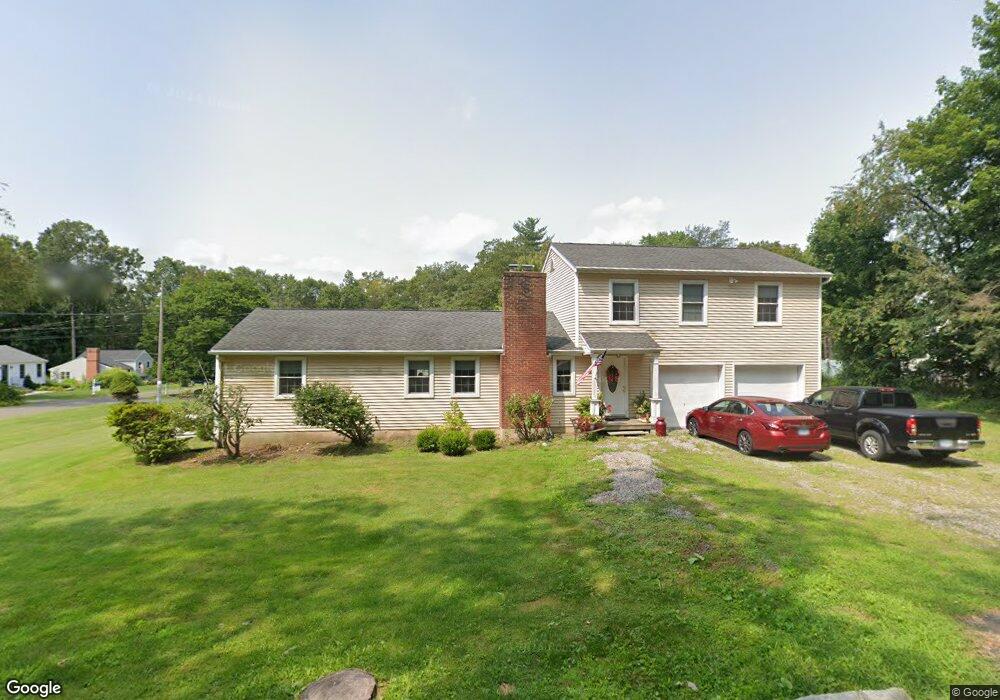
25 Olmstead Ln Ridgefield, CT 06877
Estimated Value: $887,172 - $1,146,000
3
Beds
3
Baths
2,500
Sq Ft
$385/Sq Ft
Est. Value
About This Home
This home is located at 25 Olmstead Ln, Ridgefield, CT 06877 and is currently estimated at $961,293, approximately $384 per square foot. 25 Olmstead Ln is a home located in Fairfield County with nearby schools including Branchville Elementary School, Ridgefield High School, and St. Mary School.
Ownership History
Date
Name
Owned For
Owner Type
Purchase Details
Closed on
Feb 18, 2025
Sold by
Gray Deborah K
Bought by
Scott Gray T F and Scott Gray
Current Estimated Value
Purchase Details
Closed on
Jul 7, 1999
Sold by
Mathews Herman J
Bought by
Zimmer Deborah K
Create a Home Valuation Report for This Property
The Home Valuation Report is an in-depth analysis detailing your home's value as well as a comparison with similar homes in the area
Home Values in the Area
Average Home Value in this Area
Purchase History
| Date | Buyer | Sale Price | Title Company |
|---|---|---|---|
| Scott Gray T F | -- | None Available | |
| Scott Gray T F | -- | None Available | |
| Zimmer Deborah K | $325,000 | -- | |
| Zimmer Deborah K | $325,000 | -- |
Source: Public Records
Mortgage History
| Date | Status | Borrower | Loan Amount |
|---|---|---|---|
| Previous Owner | Zimmer Deborah K | $150,000 | |
| Previous Owner | Zimmer Deborah K | $215,000 |
Source: Public Records
Tax History
| Year | Tax Paid | Tax Assessment Tax Assessment Total Assessment is a certain percentage of the fair market value that is determined by local assessors to be the total taxable value of land and additions on the property. | Land | Improvement |
|---|---|---|---|---|
| 2025 | $11,377 | $415,380 | $238,280 | $177,100 |
| 2024 | $10,945 | $415,380 | $238,280 | $177,100 |
| 2023 | $10,721 | $415,380 | $238,280 | $177,100 |
| 2022 | $11,290 | $397,130 | $210,260 | $186,870 |
| 2021 | $11,203 | $397,130 | $210,260 | $186,870 |
| 2020 | $11,167 | $397,130 | $210,260 | $186,870 |
| 2019 | $11,167 | $397,130 | $210,260 | $186,870 |
| 2018 | $11,032 | $397,130 | $210,260 | $186,870 |
| 2017 | $10,626 | $390,510 | $197,360 | $193,150 |
| 2016 | $10,423 | $390,510 | $197,360 | $193,150 |
| 2015 | $10,392 | $399,520 | $197,360 | $202,160 |
| 2014 | $10,392 | $399,520 | $197,360 | $202,160 |
Source: Public Records
Map
Nearby Homes
- 23 Olmstead Ln
- 84 Olmstead Ln
- 94 Soundview Rd
- 452 Silver Spring Rd
- 6 Sycamore Ln
- 77 Golf Ln
- 27 Country Club Rd
- 160 Wilton Rd W
- 274 Nod Rd
- 87 Silver Hill Rd
- 384 West Ln
- 134 Nod Rd
- 26 Abbott Ave
- 19 Prospect Ridge Unit 14
- 6 Morganti Ct
- 59 Prospect St Unit C
- 77 Sunset Ln Unit 213
- 77 Sunset Ln Unit 223
- 77 Sunset Ln Unit 335
- Lot 6 Cattle Pen Ln
- 28 Olmstead Ln
- 3 Seymour Ln
- 33 Olmstead Ln
- 84 S Olmstead Ln
- 20 Olmstead Ln
- 32 Olmstead Ln
- 8 Seymour Ln
- 80 S Olmstead Ln
- 351 Wilton Rd W
- 12 Olmstead Ln
- 43 Olmstead Ln
- 40 Olmstead Ln
- 12 Seymour Ln
- 25 Seymour Ln
- 9 Seymour Ln
- 58 Olmstead Ln
- 72 S Olmstead Ln
- 345 Wilton Rd W
- 347 Wilton Rd W
- 359 Wilton Rd W
Your Personal Tour Guide
Ask me questions while you tour the home.