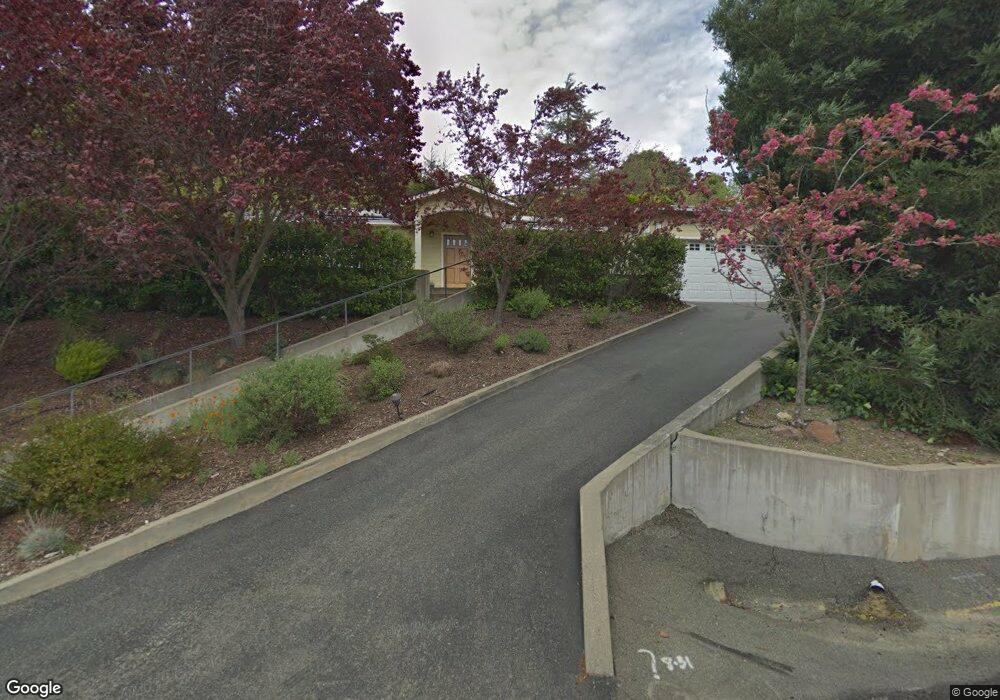
25 Parkway Ct Orinda, CA 94563
Central Orinda NeighborhoodEstimated Value: $1,697,189 - $1,982,000
3
Beds
3
Baths
2,131
Sq Ft
$862/Sq Ft
Est. Value
About This Home
This home is located at 25 Parkway Ct, Orinda, CA 94563 and is currently estimated at $1,837,797, approximately $862 per square foot. 25 Parkway Ct is a home located in Contra Costa County with nearby schools including Glorietta Elementary School, Orinda Intermediate School, and Miramonte High School.
Ownership History
Date
Name
Owned For
Owner Type
Purchase Details
Closed on
Aug 24, 2011
Sold by
Banapour Bijan and Chan Hedy
Bought by
Henstrand John M and Honig Diana J
Current Estimated Value
Home Financials for this Owner
Home Financials are based on the most recent Mortgage that was taken out on this home.
Original Mortgage
$656,000
Outstanding Balance
$451,231
Interest Rate
4.43%
Mortgage Type
New Conventional
Estimated Equity
$1,386,566
Purchase Details
Closed on
Aug 11, 1999
Sold by
Tran Vincent L and Tran Susan L
Bought by
Banapour Bijan and Chan Hedy
Home Financials for this Owner
Home Financials are based on the most recent Mortgage that was taken out on this home.
Original Mortgage
$385,000
Interest Rate
7.5%
Mortgage Type
Purchase Money Mortgage
Purchase Details
Closed on
Jan 14, 1994
Sold by
Tran Susan Lee
Bought by
Tran Vincent and Tran Susan Lee
Home Financials for this Owner
Home Financials are based on the most recent Mortgage that was taken out on this home.
Original Mortgage
$200,000
Interest Rate
7.16%
Mortgage Type
Purchase Money Mortgage
Create a Home Valuation Report for This Property
The Home Valuation Report is an in-depth analysis detailing your home's value as well as a comparison with similar homes in the area
Home Values in the Area
Average Home Value in this Area
Purchase History
| Date | Buyer | Sale Price | Title Company |
|---|---|---|---|
| Henstrand John M | $855,000 | Old Republic Title Company | |
| Banapour Bijan | $585,000 | Placer Title Company | |
| Tran Vincent | -- | Old Republic Title Company |
Source: Public Records
Mortgage History
| Date | Status | Borrower | Loan Amount |
|---|---|---|---|
| Open | Henstrand John M | $656,000 | |
| Previous Owner | Banapour Bijan | $385,000 | |
| Previous Owner | Tran Vincent | $200,000 |
Source: Public Records
Tax History Compared to Growth
Tax History
| Year | Tax Paid | Tax Assessment Tax Assessment Total Assessment is a certain percentage of the fair market value that is determined by local assessors to be the total taxable value of land and additions on the property. | Land | Improvement |
|---|---|---|---|---|
| 2025 | $14,089 | $1,079,493 | $879,232 | $200,261 |
| 2024 | $13,856 | $1,058,328 | $861,993 | $196,335 |
| 2023 | $13,856 | $1,037,578 | $845,092 | $192,486 |
| 2022 | $13,404 | $1,017,234 | $828,522 | $188,712 |
| 2021 | $13,137 | $997,289 | $812,277 | $185,012 |
| 2019 | $12,904 | $962,711 | $788,186 | $174,525 |
| 2018 | $11,927 | $943,835 | $772,732 | $171,103 |
| 2017 | $11,595 | $925,330 | $757,581 | $167,749 |
| 2016 | $11,313 | $907,187 | $742,727 | $164,460 |
| 2015 | $11,249 | $893,561 | $731,571 | $161,990 |
| 2014 | $11,088 | $876,058 | $717,241 | $158,817 |
Source: Public Records
Map
Nearby Homes
- 0 Glorietta Blvd
- 3 Monroe Ct
- 117 Estates Dr
- 5 Broadview Terrace
- 4 Greenwood Ct
- 90 Estates Dr
- 16 Wendy Ln
- 231 Orchard Rd
- 123 Orchard Rd
- 4161 Coralee Ln
- 58 Zander Ct
- 38 Oak Ridge Ln
- 1 Vista Del Moraga
- 82 Zander Dr
- 853 Revere Rd
- 131 Moraga Way
- 42 Crestview Dr
- 225 Rheem Blvd
- 205 Crestview Dr
- 75 Donald Dr