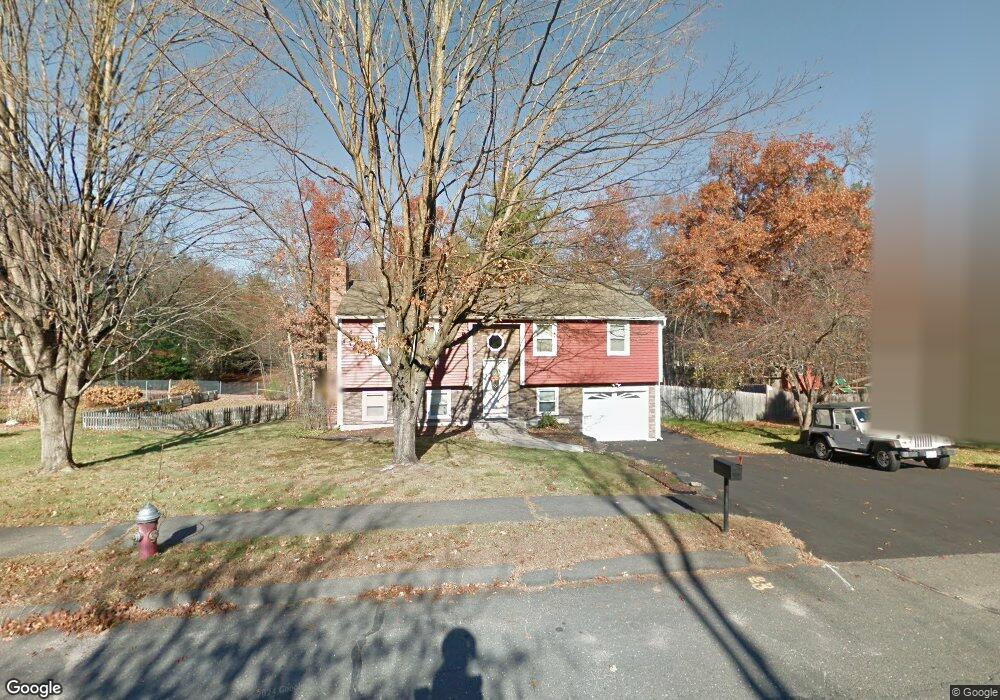
25 Picard Cir Easthampton, MA 01027
Estimated Value: $368,815 - $427,000
4
Beds
3
Baths
1,085
Sq Ft
$366/Sq Ft
Est. Value
About This Home
This home is located at 25 Picard Cir, Easthampton, MA 01027 and is currently estimated at $396,954, approximately $365 per square foot. 25 Picard Cir is a home located in Hampshire County with nearby schools including Easthampton High School, Hilltown Cooperative Charter Public School, and Calvary Baptist Christian School.
Ownership History
Date
Name
Owned For
Owner Type
Purchase Details
Closed on
Mar 17, 2006
Sold by
Moynihan Garrett J and Sears Kristina M
Bought by
Sears Kristina M
Current Estimated Value
Purchase Details
Closed on
Apr 20, 2001
Sold by
Gretzinger Gerard M and Gretzinger Karen H
Bought by
Moynihan Garrett J and Sears Kristina M
Purchase Details
Closed on
Feb 26, 1999
Sold by
Gasperini John R and Gasperini Mary E
Bought by
Gretzinger Gerard M and Gretzinger Karen H
Create a Home Valuation Report for This Property
The Home Valuation Report is an in-depth analysis detailing your home's value as well as a comparison with similar homes in the area
Home Values in the Area
Average Home Value in this Area
Purchase History
| Date | Buyer | Sale Price | Title Company |
|---|---|---|---|
| Sears Kristina M | -- | -- | |
| Moynihan Garrett J | $149,000 | -- | |
| Gretzinger Gerard M | $125,500 | -- |
Source: Public Records
Mortgage History
| Date | Status | Borrower | Loan Amount |
|---|---|---|---|
| Open | Gretzinger Gerard M | $212,049 | |
| Closed | Gretzinger Gerard M | $219,423 |
Source: Public Records
Tax History
| Year | Tax Paid | Tax Assessment Tax Assessment Total Assessment is a certain percentage of the fair market value that is determined by local assessors to be the total taxable value of land and additions on the property. | Land | Improvement |
|---|---|---|---|---|
| 2025 | $4,059 | $296,900 | $115,800 | $181,100 |
| 2024 | $3,917 | $288,900 | $112,400 | $176,500 |
| 2023 | $3,280 | $223,900 | $88,800 | $135,100 |
| 2022 | $3,701 | $223,900 | $88,800 | $135,100 |
| 2021 | $4,041 | $230,400 | $88,800 | $141,600 |
| 2020 | $3,976 | $223,900 | $88,800 | $135,100 |
| 2019 | $3,461 | $223,900 | $88,800 | $135,100 |
| 2018 | $3,336 | $208,500 | $83,900 | $124,600 |
| 2017 | $3,263 | $201,300 | $80,700 | $120,600 |
| 2016 | $3,138 | $201,300 | $80,700 | $120,600 |
| 2015 | $3,050 | $201,300 | $80,700 | $120,600 |
Source: Public Records
Map
Nearby Homes
Your Personal Tour Guide
Ask me questions while you tour the home.