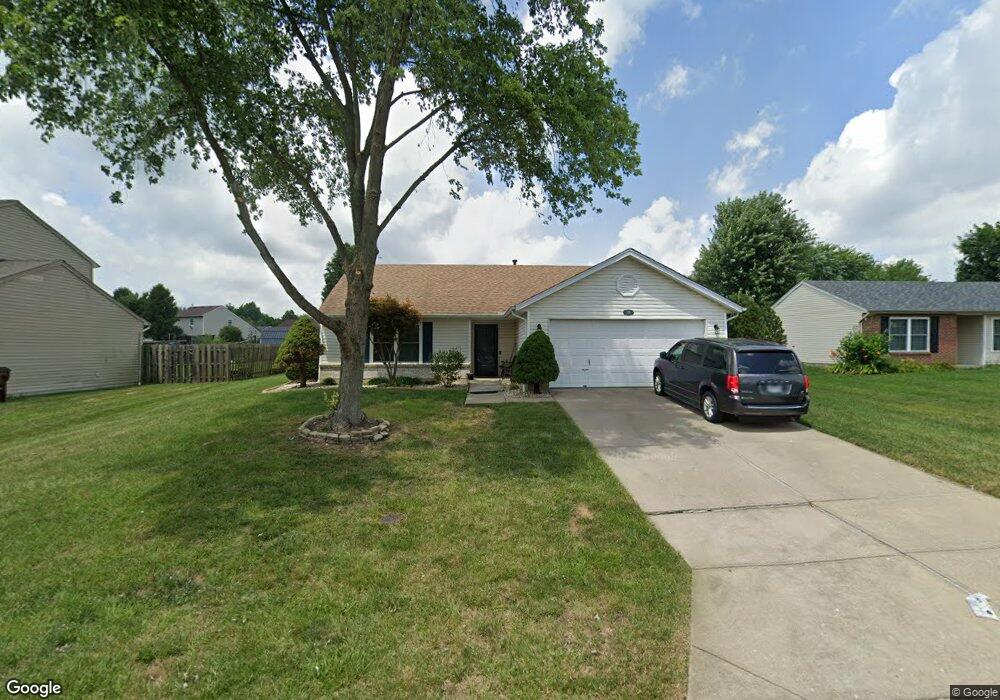
25 Robin Way Unit L137 Amelia, OH 45102
Estimated Value: $276,000 - $290,000
3
Beds
2
Baths
1,224
Sq Ft
$230/Sq Ft
Est. Value
About This Home
This home is located at 25 Robin Way Unit L137, Amelia, OH 45102 and is currently estimated at $281,389, approximately $229 per square foot. 25 Robin Way Unit L137 is a home located in Clermont County with nearby schools including Amelia Elementary School, West Clermont Middle School, and West Clermont High School.
Ownership History
Date
Name
Owned For
Owner Type
Purchase Details
Closed on
Oct 6, 2023
Sold by
Hurst Onder B and Hurst Melanie
Bought by
Davidson Edward Don
Current Estimated Value
Purchase Details
Closed on
Oct 21, 2002
Sold by
Demasters Jeffrey G
Bought by
Hurst Onder B and Hurst Melanie
Home Financials for this Owner
Home Financials are based on the most recent Mortgage that was taken out on this home.
Original Mortgage
$85,000
Interest Rate
6.24%
Mortgage Type
New Conventional
Purchase Details
Closed on
Feb 5, 1999
Sold by
Crossmann Communities Of
Bought by
Demasters Jeffrey G and Demasters Marsha A
Home Financials for this Owner
Home Financials are based on the most recent Mortgage that was taken out on this home.
Original Mortgage
$112,200
Interest Rate
6.81%
Mortgage Type
VA
Create a Home Valuation Report for This Property
The Home Valuation Report is an in-depth analysis detailing your home's value as well as a comparison with similar homes in the area
Home Values in the Area
Average Home Value in this Area
Purchase History
| Date | Buyer | Sale Price | Title Company |
|---|---|---|---|
| Davidson Edward Don | $258,000 | Mattingly Ford Title | |
| Davidson Edward Don | $258,000 | Mattingly Ford Title | |
| Hurst Onder B | $120,000 | -- | |
| Demasters Jeffrey G | $110,000 | -- |
Source: Public Records
Mortgage History
| Date | Status | Borrower | Loan Amount |
|---|---|---|---|
| Previous Owner | Hurst Onder B | $85,000 | |
| Previous Owner | Demasters Jeffrey G | $112,200 |
Source: Public Records
Tax History
| Year | Tax Paid | Tax Assessment Tax Assessment Total Assessment is a certain percentage of the fair market value that is determined by local assessors to be the total taxable value of land and additions on the property. | Land | Improvement |
|---|---|---|---|---|
| 2024 | $3,704 | $72,520 | $14,910 | $57,610 |
| 2023 | $3,709 | $72,520 | $14,910 | $57,610 |
| 2022 | $3,006 | $51,100 | $10,500 | $40,600 |
| 2021 | $2,972 | $51,100 | $10,500 | $40,600 |
| 2020 | $2,973 | $51,100 | $10,500 | $40,600 |
| 2019 | $2,268 | $42,630 | $10,290 | $32,340 |
| 2018 | $2,290 | $42,630 | $10,290 | $32,340 |
| 2017 | $2,245 | $42,630 | $10,290 | $32,340 |
| 2016 | $2,245 | $37,730 | $9,100 | $28,630 |
| 2015 | $2,099 | $37,730 | $9,100 | $28,630 |
| 2014 | $2,097 | $37,730 | $9,100 | $28,630 |
| 2013 | $2,089 | $37,240 | $10,500 | $26,740 |
Source: Public Records
Map
Nearby Homes
Your Personal Tour Guide
Ask me questions while you tour the home.