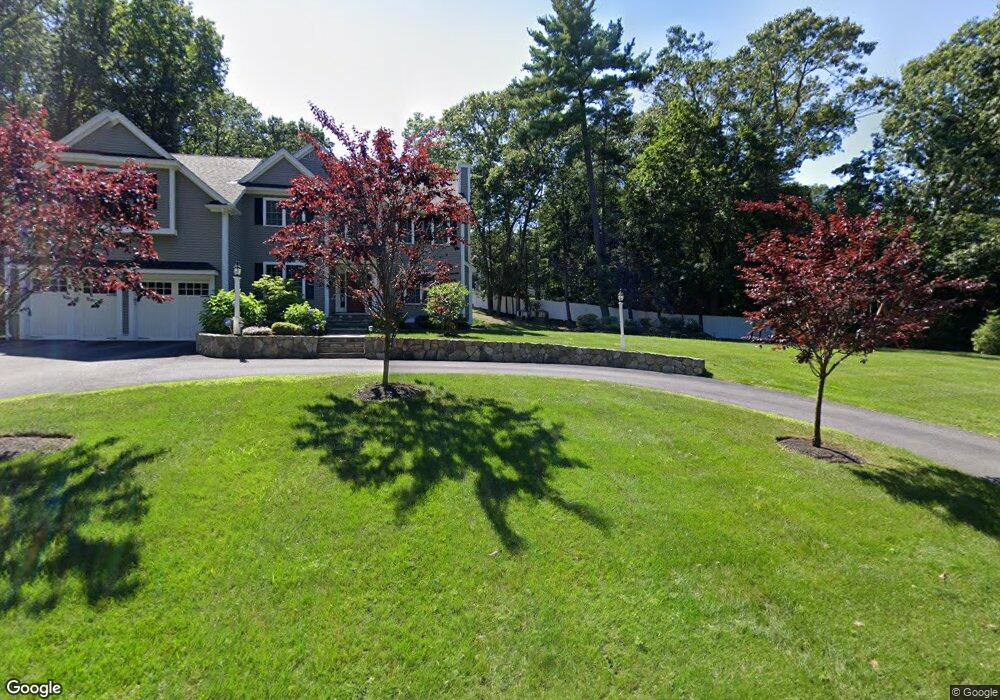
25 Rolling Ln Weston, MA 02493
Estimated Value: $2,282,971 - $2,994,000
4
Beds
4
Baths
3,983
Sq Ft
$669/Sq Ft
Est. Value
About This Home
This home is located at 25 Rolling Ln, Weston, MA 02493 and is currently estimated at $2,663,993, approximately $668 per square foot. 25 Rolling Ln is a home located in Middlesex County with nearby schools including Country Elementary School, Woodland Elementary School, and Field Elementary School.
Ownership History
Date
Name
Owned For
Owner Type
Purchase Details
Closed on
May 23, 2011
Sold by
Gordon Steven J
Bought by
Gordon Steven J and Gordon Mary T
Current Estimated Value
Home Financials for this Owner
Home Financials are based on the most recent Mortgage that was taken out on this home.
Original Mortgage
$294,000
Interest Rate
4.88%
Mortgage Type
Purchase Money Mortgage
Purchase Details
Closed on
Jul 15, 1994
Sold by
Azuma Tsutomo and Azuma Kimiko
Bought by
Gordon Steven J
Purchase Details
Closed on
Mar 25, 1988
Sold by
Landry Robert F
Bought by
Robinson John M
Create a Home Valuation Report for This Property
The Home Valuation Report is an in-depth analysis detailing your home's value as well as a comparison with similar homes in the area
Home Values in the Area
Average Home Value in this Area
Purchase History
| Date | Buyer | Sale Price | Title Company |
|---|---|---|---|
| Gordon Steven J | -- | -- | |
| Gordon Steven J | $457,000 | -- | |
| Robinson John M | $455,000 | -- |
Source: Public Records
Mortgage History
| Date | Status | Borrower | Loan Amount |
|---|---|---|---|
| Closed | Gordon Steven J | $294,000 | |
| Previous Owner | Robinson John M | $30,000 | |
| Previous Owner | Robinson John M | $495,000 |
Source: Public Records
Tax History Compared to Growth
Tax History
| Year | Tax Paid | Tax Assessment Tax Assessment Total Assessment is a certain percentage of the fair market value that is determined by local assessors to be the total taxable value of land and additions on the property. | Land | Improvement |
|---|---|---|---|---|
| 2025 | $22,905 | $2,063,500 | $841,800 | $1,221,700 |
| 2024 | $22,398 | $2,014,200 | $841,800 | $1,172,400 |
| 2023 | $22,399 | $1,891,800 | $841,800 | $1,050,000 |
| 2022 | $21,174 | $1,652,900 | $795,600 | $857,300 |
| 2021 | $4,150 | $1,577,200 | $757,600 | $819,600 |
| 2020 | $3,933 | $1,532,700 | $757,600 | $775,100 |
| 2019 | $7,352 | $1,494,400 | $724,900 | $769,500 |
| 2018 | $3,440 | $1,494,400 | $724,900 | $769,500 |
| 2017 | $18,533 | $1,494,600 | $724,900 | $769,700 |
| 2016 | $18,174 | $1,494,600 | $724,900 | $769,700 |
| 2015 | $17,686 | $1,440,200 | $690,700 | $749,500 |
Source: Public Records
Map
Nearby Homes