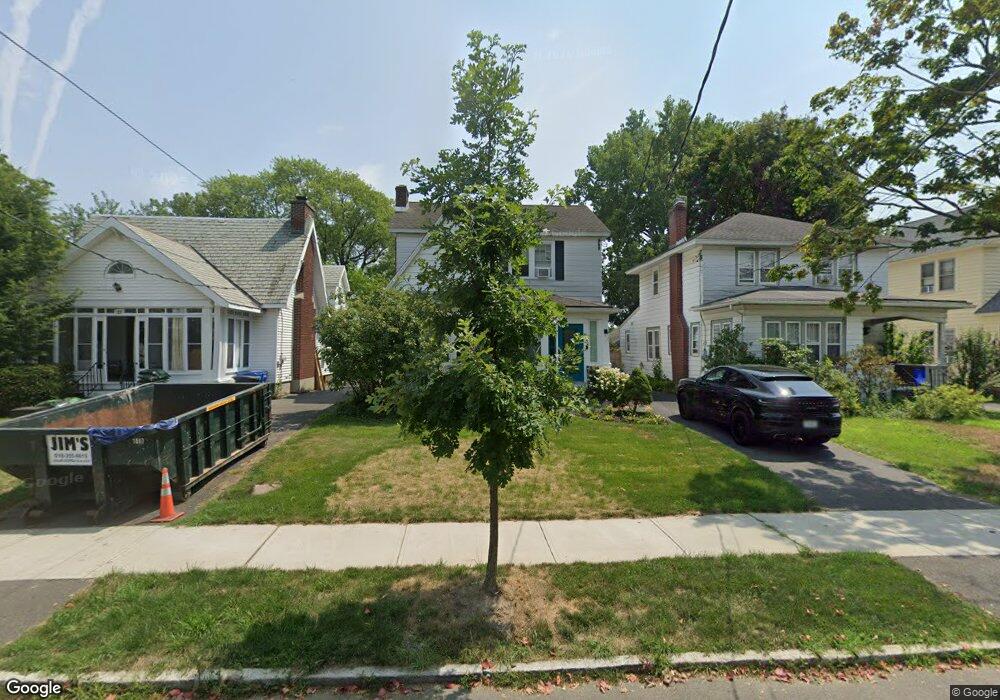
25 Rose Ct Albany, NY 12209
Delaware Avenue NeighborhoodEstimated Value: $272,000 - $304,000
3
Beds
2
Baths
1,334
Sq Ft
$216/Sq Ft
Est. Value
About This Home
This home is located at 25 Rose Ct, Albany, NY 12209 and is currently estimated at $287,626, approximately $215 per square foot. 25 Rose Ct is a home located in Albany County with nearby schools including New Scotland Elementary School, William S Hackett Middle School, and Albany High School.
Ownership History
Date
Name
Owned For
Owner Type
Purchase Details
Closed on
Dec 20, 2007
Sold by
Brown Maureen
Bought by
Ciccone Louise
Current Estimated Value
Home Financials for this Owner
Home Financials are based on the most recent Mortgage that was taken out on this home.
Original Mortgage
$177,175
Outstanding Balance
$111,970
Interest Rate
6.27%
Mortgage Type
New Conventional
Estimated Equity
$175,656
Purchase Details
Closed on
Feb 9, 1999
Purchase Details
Closed on
Feb 7, 1996
Sold by
Zollo Francis M
Bought by
Worden Maureen
Create a Home Valuation Report for This Property
The Home Valuation Report is an in-depth analysis detailing your home's value as well as a comparison with similar homes in the area
Home Values in the Area
Average Home Value in this Area
Purchase History
| Date | Buyer | Sale Price | Title Company |
|---|---|---|---|
| Ciccone Louise | $186,500 | -- | |
| Ciccone Louise A | $186,500 | None Available | |
| -- | -- | -- | |
| Brown Maureen A | -- | -- | |
| Worden Maureen | $106,500 | -- |
Source: Public Records
Mortgage History
| Date | Status | Borrower | Loan Amount |
|---|---|---|---|
| Open | Ciccone Louise A | $177,175 | |
| Closed | Ciccone Louise | $177,175 |
Source: Public Records
Tax History Compared to Growth
Tax History
| Year | Tax Paid | Tax Assessment Tax Assessment Total Assessment is a certain percentage of the fair market value that is determined by local assessors to be the total taxable value of land and additions on the property. | Land | Improvement |
|---|---|---|---|---|
| 2024 | $5,569 | $222,000 | $44,400 | $177,600 |
| 2023 | $6,700 | $181,000 | $36,000 | $145,000 |
| 2022 | $6,475 | $181,000 | $36,000 | $145,000 |
| 2021 | $6,435 | $181,000 | $36,000 | $145,000 |
| 2020 | $6,305 | $181,000 | $36,000 | $145,000 |
| 2019 | $7,126 | $181,000 | $36,000 | $145,000 |
| 2018 | $6,311 | $181,000 | $36,000 | $145,000 |
| 2017 | $2,710 | $181,000 | $36,000 | $145,000 |
| 2016 | $6,134 | $181,000 | $36,000 | $145,000 |
| 2015 | $6,293 | $186,500 | $41,900 | $144,600 |
| 2014 | -- | $186,500 | $41,900 | $144,600 |
Source: Public Records
Map
Nearby Homes