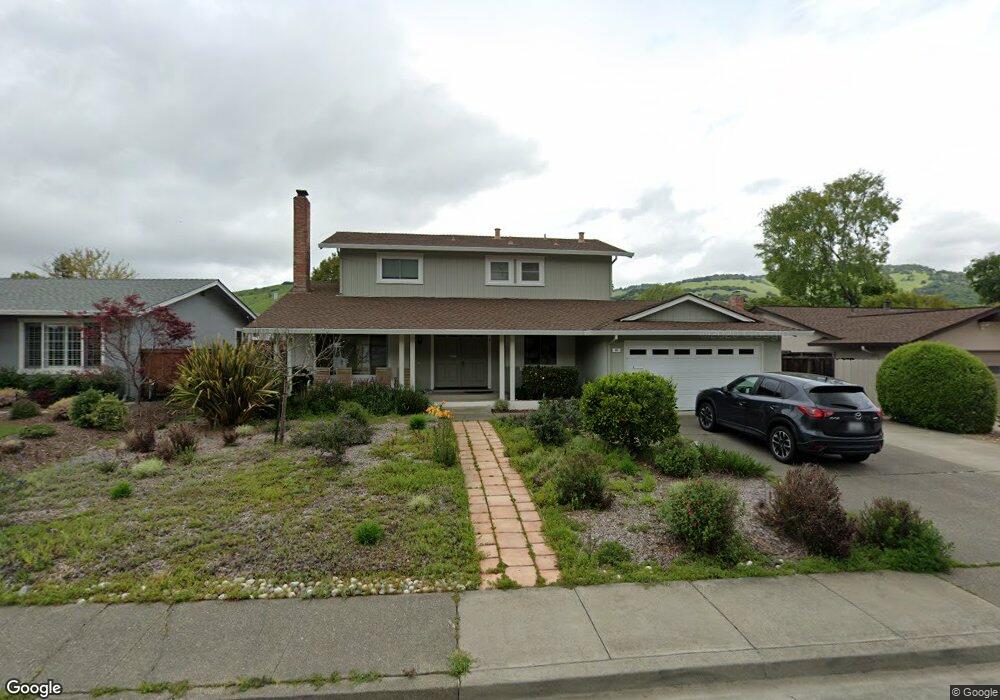
25 San Miguel Way Novato, CA 94945
San Marin NeighborhoodEstimated Value: $1,049,000 - $1,305,000
4
Beds
3
Baths
1,808
Sq Ft
$653/Sq Ft
Est. Value
About This Home
This home is located at 25 San Miguel Way, Novato, CA 94945 and is currently estimated at $1,180,609, approximately $652 per square foot. 25 San Miguel Way is a home located in Marin County with nearby schools including San Ramon Elementary School, Sinaloa Middle School, and San Marin High School.
Ownership History
Date
Name
Owned For
Owner Type
Purchase Details
Closed on
Oct 8, 2020
Sold by
Nemerovski Robert A and Nemerovski Shari L
Bought by
Nemerovski Robert A and Nemerovski Shari L
Current Estimated Value
Home Financials for this Owner
Home Financials are based on the most recent Mortgage that was taken out on this home.
Original Mortgage
$350,489
Outstanding Balance
$311,173
Interest Rate
2.8%
Mortgage Type
New Conventional
Estimated Equity
$869,436
Purchase Details
Closed on
Mar 2, 2019
Sold by
Nemerovski Robert A and Nemerovski Shari
Bought by
Nemerovski Robert A Nemerovksi and Nemerovski Shari L
Purchase Details
Closed on
Feb 1, 2001
Sold by
Mathew Rosemond B and Rosemond Marjorie J
Bought by
Nemerovski Robert A and Nemerovski Shari
Home Financials for this Owner
Home Financials are based on the most recent Mortgage that was taken out on this home.
Original Mortgage
$300,000
Interest Rate
6.85%
Create a Home Valuation Report for This Property
The Home Valuation Report is an in-depth analysis detailing your home's value as well as a comparison with similar homes in the area
Home Values in the Area
Average Home Value in this Area
Purchase History
| Date | Buyer | Sale Price | Title Company |
|---|---|---|---|
| Nemerovski Robert A | -- | Amrock Llc | |
| Nemerovski Robert A | -- | Amrock Llc | |
| Nemerovski Robert A Nemerovksi | -- | None Available | |
| Nemerovski Robert A | $505,000 | First American Title Co |
Source: Public Records
Mortgage History
| Date | Status | Borrower | Loan Amount |
|---|---|---|---|
| Open | Nemerovski Robert A | $350,489 | |
| Closed | Nemerovski Robert A | $300,000 | |
| Closed | Nemerovski Robert A | $100,000 |
Source: Public Records
Tax History Compared to Growth
Tax History
| Year | Tax Paid | Tax Assessment Tax Assessment Total Assessment is a certain percentage of the fair market value that is determined by local assessors to be the total taxable value of land and additions on the property. | Land | Improvement |
|---|---|---|---|---|
| 2025 | $10,159 | $777,690 | $361,615 | $416,075 |
| 2024 | $10,159 | $762,443 | $354,525 | $407,918 |
| 2023 | $9,939 | $747,496 | $347,575 | $399,921 |
| 2022 | $9,705 | $732,841 | $340,761 | $392,080 |
| 2021 | $9,692 | $718,473 | $334,080 | $384,393 |
| 2020 | $9,539 | $711,107 | $330,655 | $380,452 |
| 2019 | $9,229 | $697,165 | $324,172 | $372,993 |
| 2018 | $9,092 | $683,499 | $317,817 | $365,682 |
| 2017 | $8,928 | $670,099 | $311,587 | $358,512 |
| 2016 | $8,293 | $656,964 | $305,479 | $351,485 |
| 2015 | $8,157 | $647,100 | $300,892 | $346,208 |
| 2014 | $8,012 | $634,428 | $295,000 | $339,428 |
Source: Public Records
Map
Nearby Homes
- 70 San Carlos Way
- 90 San Benito Way
- 106 Oliva Ct Unit C
- 2094 Center Rd
- 36 Andreas Ct
- 105 Holstrom Cir
- 2009 Hawthorne Terrace
- 765 Sun Ln
- 11 Katlas Ct
- 2062 Feliz Rd
- 334 San Marin Dr
- 7 Laurie Ct
- 159 Michele Cir
- 2449 Center Rd
- 998 Simmons Ln
- 840 Wilmac Ave
- 13 Margory Ct
- 35 San Joaquin Place
- 846 Wilmac Ave
- 26 Sotelo Way
- 21 San Miguel Way
- 27 San Miguel Way
- 124 San Carlos Way
- 19 San Miguel Way
- 31 San Miguel Way
- 126 San Carlos Way
- 120 San Carlos Way
- 26 San Miguel Way
- 22 San Miguel Way
- 130 San Carlos Way
- 28 San Miguel Way
- 17 San Miguel Way
- 33 San Miguel Way
- 20 San Miguel Way
- 30 San Miguel Way
- 18 San Miguel Way
- 132 San Carlos Way
- 114 San Carlos Way
- 15 San Miguel Way