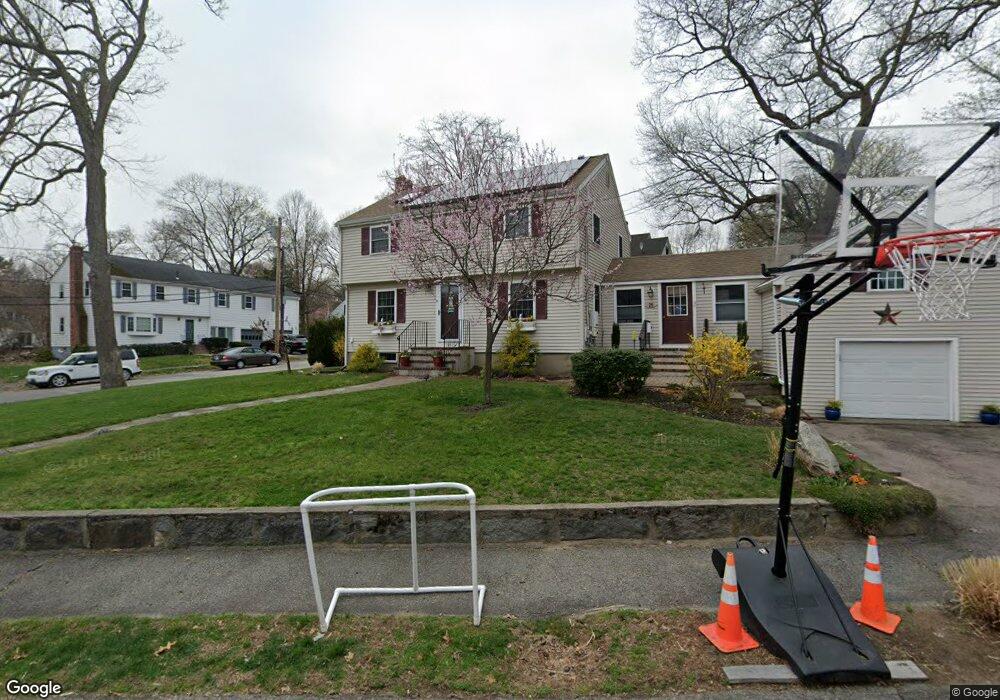
25 Savin St Milton, MA 02186
Brush Hill NeighborhoodEstimated Value: $842,000 - $1,128,000
3
Beds
2
Baths
1,350
Sq Ft
$705/Sq Ft
Est. Value
About This Home
This home is located at 25 Savin St, Milton, MA 02186 and is currently estimated at $951,416, approximately $704 per square foot. 25 Savin St is a home located in Norfolk County with nearby schools including Milton High School, KIPP Academy Boston Charter School, and Delphi Academy of Boston.
Ownership History
Date
Name
Owned For
Owner Type
Purchase Details
Closed on
Apr 17, 2009
Sold by
Savvy Rt
Bought by
Fater Gregory P and Fater Kelly Ln
Current Estimated Value
Home Financials for this Owner
Home Financials are based on the most recent Mortgage that was taken out on this home.
Original Mortgage
$360,000
Outstanding Balance
$228,554
Interest Rate
5.02%
Mortgage Type
Purchase Money Mortgage
Estimated Equity
$722,862
Purchase Details
Closed on
Jun 27, 2008
Sold by
Bank Of New York
Bought by
Savvy Rt
Purchase Details
Closed on
Jan 22, 2008
Sold by
Lebeau Ralph and Mers
Bought by
Bank Of New York
Purchase Details
Closed on
Oct 13, 2004
Sold by
Lebeau Kimani
Bought by
Lebeau Ralph
Home Financials for this Owner
Home Financials are based on the most recent Mortgage that was taken out on this home.
Original Mortgage
$267,150
Interest Rate
5.8%
Mortgage Type
Purchase Money Mortgage
Create a Home Valuation Report for This Property
The Home Valuation Report is an in-depth analysis detailing your home's value as well as a comparison with similar homes in the area
Home Values in the Area
Average Home Value in this Area
Purchase History
| Date | Buyer | Sale Price | Title Company |
|---|---|---|---|
| Fater Gregory P | $400,000 | -- | |
| Savvy Rt | $215,000 | -- | |
| Bank Of New York | $331,859 | -- | |
| Lebeau Ralph | -- | -- |
Source: Public Records
Mortgage History
| Date | Status | Borrower | Loan Amount |
|---|---|---|---|
| Open | Fater Gregory P | $360,000 | |
| Previous Owner | Lebeau Ralph | $267,150 |
Source: Public Records
Tax History Compared to Growth
Tax History
| Year | Tax Paid | Tax Assessment Tax Assessment Total Assessment is a certain percentage of the fair market value that is determined by local assessors to be the total taxable value of land and additions on the property. | Land | Improvement |
|---|---|---|---|---|
| 2025 | $8,797 | $793,200 | $368,300 | $424,900 |
| 2024 | $8,757 | $801,900 | $368,300 | $433,600 |
| 2023 | $8,719 | $764,800 | $367,000 | $397,800 |
| 2022 | $8,435 | $676,400 | $367,000 | $309,400 |
| 2021 | $8,163 | $621,700 | $327,000 | $294,700 |
| 2020 | $7,763 | $591,700 | $302,300 | $289,400 |
| 2019 | $7,572 | $574,500 | $293,500 | $281,000 |
| 2018 | $7,191 | $520,700 | $245,200 | $275,500 |
| 2017 | $6,733 | $496,500 | $233,600 | $262,900 |
| 2016 | $6,433 | $476,500 | $219,000 | $257,500 |
| 2015 | $6,196 | $444,500 | $201,400 | $243,100 |
Source: Public Records
Map
Nearby Homes
- 40 Lafayette St
- 405 Blue Hill Ave
- 10 Weston St
- 485 Blue Hills Pkwy Unit 11
- 485 Blue Hills Pkwy Unit 27
- 485 Blue Hills Pkwy Unit 6
- 485 Blue Hills Pkwy Unit 21
- 485 Blue Hills Pkwy Unit 44
- 485 Blue Hills Pkwy Unit 23
- 485 Blue Hills Pkwy Unit 20
- 485 Blue Hills Pkwy Unit 26
- 485 Blue Hills Pkwy Unit 28
- 485 Blue Hills Pkwy Unit 2
- 485 Blue Hills Pkwy Unit 33
- 16 Concord Ave Unit 1
- 350 Blue Hill Ave
- 70 Warren Ave
- 1 Chilton Park
- 200 Robbins St
- 112 Brush Hill Rd
- 137 Ferncroft Rd
- 136 Ferncroft Rd
- 49 Victoria St
- 26 Savin St
- 22 Savin St
- 128 Ferncroft Rd
- 30 Savin St
- 15 Savin St
- 16 Savin St
- 140 Ferncroft Rd
- 45 Victoria St
- 117 Ferncroft Rd
- 144 Ferncroft Rd
- 61 Victoria St
- 120 Ferncroft Rd
- 147 Ferncroft Rd
- 116 Ferncroft Rd
- 148 Ferncroft Rd
- 105 Ferncroft Rd
- 51 Pagoda Cir