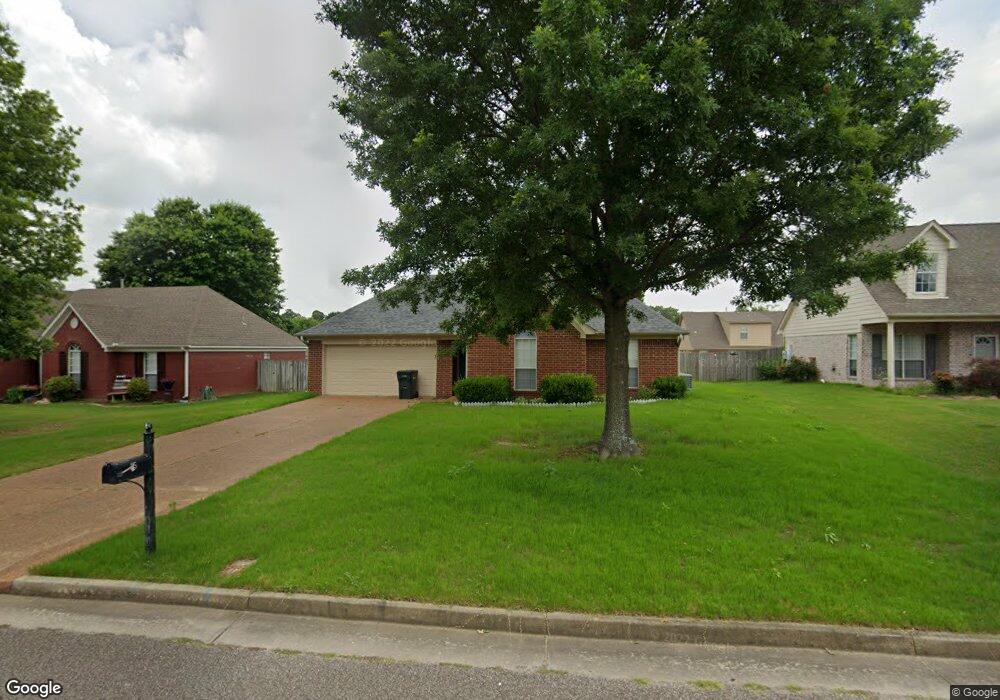
25 Spring Valley Dr Unit 2314486-59551 Oakland, TN 38060
Estimated Value: $254,633 - $263,000
--
Bed
3
Baths
1,256
Sq Ft
$205/Sq Ft
Est. Value
About This Home
This home is located at 25 Spring Valley Dr Unit 2314486-59551, Oakland, TN 38060 and is currently estimated at $257,658, approximately $205 per square foot. 25 Spring Valley Dr Unit 2314486-59551 is a home located in Fayette County with nearby schools including Oakland Elementary School, West Junior High School, and Fayette Ware Comprehensive High School.
Ownership History
Date
Name
Owned For
Owner Type
Purchase Details
Closed on
May 18, 2022
Sold by
Palkoner Laura A
Bought by
Pine Grove Residential Funding I Llc
Current Estimated Value
Purchase Details
Closed on
May 23, 2019
Sold by
Mathis Philip and Mathis Jessica Elaine
Bought by
Palkoner Laura A
Home Financials for this Owner
Home Financials are based on the most recent Mortgage that was taken out on this home.
Original Mortgage
$148,500
Interest Rate
4.1%
Mortgage Type
New Conventional
Purchase Details
Closed on
Dec 20, 2001
Sold by
Skip Hobbs Construction
Bought by
Mathis Philip
Home Financials for this Owner
Home Financials are based on the most recent Mortgage that was taken out on this home.
Original Mortgage
$109,038
Interest Rate
6.49%
Purchase Details
Closed on
Nov 17, 2000
Bought by
Skip Hobbs Construction Llc
Create a Home Valuation Report for This Property
The Home Valuation Report is an in-depth analysis detailing your home's value as well as a comparison with similar homes in the area
Home Values in the Area
Average Home Value in this Area
Purchase History
| Date | Buyer | Sale Price | Title Company |
|---|---|---|---|
| Pine Grove Residential Funding I Llc | $265,000 | New Title Company Name | |
| Palkoner Laura A | $149,000 | Realty Title & Escrow Co Inc | |
| Mathis Philip | $109,900 | -- | |
| Skip Hobbs Construction Llc | $1,200,000 | -- |
Source: Public Records
Mortgage History
| Date | Status | Borrower | Loan Amount |
|---|---|---|---|
| Previous Owner | Palkoner Laura A | $148,500 | |
| Previous Owner | Skip Hobbs Construction Llc | $109,038 |
Source: Public Records
Tax History Compared to Growth
Tax History
| Year | Tax Paid | Tax Assessment Tax Assessment Total Assessment is a certain percentage of the fair market value that is determined by local assessors to be the total taxable value of land and additions on the property. | Land | Improvement |
|---|---|---|---|---|
| 2024 | $528 | $41,650 | $9,500 | $32,150 |
| 2023 | $1,076 | $41,650 | $0 | $0 |
| 2022 | $713 | $41,650 | $9,500 | $32,150 |
| 2021 | $713 | $41,650 | $9,500 | $32,150 |
| 2020 | $478 | $41,650 | $9,500 | $32,150 |
| 2019 | $643 | $31,700 | $7,500 | $24,200 |
| 2018 | $662 | $31,700 | $7,500 | $24,200 |
| 2017 | $564 | $31,700 | $7,500 | $24,200 |
| 2016 | $563 | $29,575 | $7,500 | $22,075 |
| 2015 | $563 | $29,575 | $7,500 | $22,075 |
| 2014 | $563 | $29,575 | $7,500 | $22,075 |
Source: Public Records
Map
Nearby Homes
- 30 Mossy Springs Cove
- 245 Mossy Springs Dr
- 70 Valleyview Ln
- 270 Oak St
- 245 Susanne Dr
- 165 Susanne Dr
- 0 Mcfadden Dr Unit 10209515
- 000 Hwy 64
- 45 Sadie Cove
- 24.17 AC Tennessee 194
- 40 Windy Cove
- 0 Mcauley St Unit 10186597
- 170 Oakland Ridge Cove
- 25 Breezy Loop
- 300 Saint Andrews Dr
- 290 Saint Andrews Dr
- 360 Saint Andrews Dr
- 65 Cleer Ave
- 50 High St
- 40 Gracie Cove
- 25 Spring Valley Dr
- 35 Spring Valley Dr
- 15 Spring Valley Dr
- 155 Garden View Dr
- 45 Spring Valley Dr
- 45 Spring Valley Dr Unit 2290326-59551
- 165 Garden View Dr
- 145 Garden View Dr
- 5 Spring Valley Dr
- 135 Garden View Dr
- 175 Garden View Dr
- 55 Spring Valley Dr
- 10 Spring Valley Dr
- 30 Spring Valley Dr
- 30 Spring Valley Dr Unit 2314481-59551
- 0 McFadden (56 Acres) Dr Unit 10009505
- 0 McFadden (44 Acres) Dr Unit 10009499
- 20 Spring Valley Dr
- 20 Spring Valley Dr Unit 2311878-59551
- 40 Spring Valley Dr