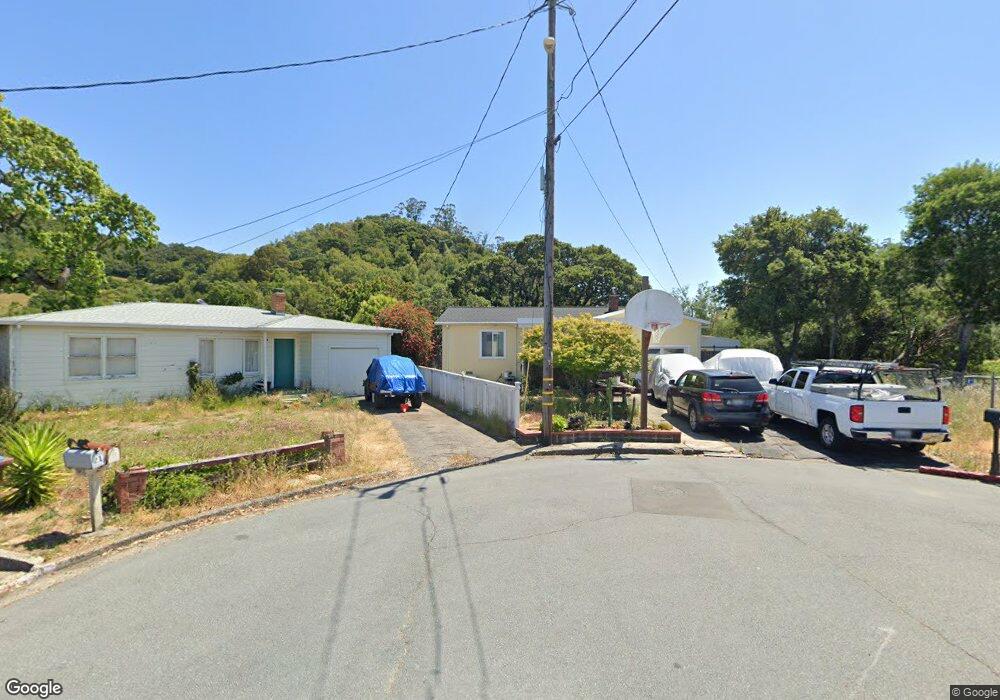
25 Tarrant Ct San Rafael, CA 94903
Marin Civic Center NeighborhoodEstimated Value: $990,000 - $2,361,407
2
Beds
1
Bath
1,002
Sq Ft
$1,428/Sq Ft
Est. Value
About This Home
This home is located at 25 Tarrant Ct, San Rafael, CA 94903 and is currently estimated at $1,430,852, approximately $1,427 per square foot. 25 Tarrant Ct is a home located in Marin County with nearby schools including Venetia Valley K-8 School, James B. Davidson Middle School, and Terra Linda High School.
Ownership History
Date
Name
Owned For
Owner Type
Purchase Details
Closed on
May 30, 2020
Sold by
Beaulieu Brian and Beaulieu Kathleen
Bought by
Beaulieu Brian and Beaulieu Kathleen J
Current Estimated Value
Purchase Details
Closed on
Mar 2, 2017
Sold by
Bacho John L and Bacho Renea Lupe
Bought by
Beaulieu Brain and Beaulieu Kathleen
Home Financials for this Owner
Home Financials are based on the most recent Mortgage that was taken out on this home.
Original Mortgage
$401,000
Outstanding Balance
$332,715
Interest Rate
4.19%
Mortgage Type
New Conventional
Estimated Equity
$1,098,137
Purchase Details
Closed on
Jul 1, 1997
Sold by
Duffy Carol L and Columba Duffy
Bought by
Bacho John L and Bacho Renea Lupe
Home Financials for this Owner
Home Financials are based on the most recent Mortgage that was taken out on this home.
Original Mortgage
$214,600
Interest Rate
7.92%
Create a Home Valuation Report for This Property
The Home Valuation Report is an in-depth analysis detailing your home's value as well as a comparison with similar homes in the area
Home Values in the Area
Average Home Value in this Area
Purchase History
| Date | Buyer | Sale Price | Title Company |
|---|---|---|---|
| Beaulieu Brian | -- | None Available | |
| Beaulieu Brain | $1,750,090 | Old Republic Title Co | |
| Bacho John L | $226,000 | California Land Title Co |
Source: Public Records
Mortgage History
| Date | Status | Borrower | Loan Amount |
|---|---|---|---|
| Open | Beaulieu Brain | $401,000 | |
| Previous Owner | Bacho John L | $214,600 |
Source: Public Records
Tax History Compared to Growth
Tax History
| Year | Tax Paid | Tax Assessment Tax Assessment Total Assessment is a certain percentage of the fair market value that is determined by local assessors to be the total taxable value of land and additions on the property. | Land | Improvement |
|---|---|---|---|---|
| 2025 | $10,921 | $720,706 | $395,750 | $324,956 |
| 2024 | $10,921 | $706,579 | $387,993 | $318,586 |
| 2023 | $10,695 | $692,725 | $380,385 | $312,340 |
| 2022 | $10,040 | $679,143 | $372,927 | $306,216 |
| 2021 | $9,794 | $665,829 | $365,616 | $300,213 |
| 2020 | $9,621 | $659,005 | $361,869 | $297,136 |
| 2019 | $9,293 | $646,088 | $354,776 | $291,312 |
| 2018 | $9,171 | $633,420 | $347,820 | $285,600 |
| 2017 | $5,202 | $310,920 | $163,262 | $147,658 |
| 2016 | $5,015 | $304,826 | $160,062 | $144,764 |
| 2015 | $4,737 | $300,246 | $157,657 | $142,589 |
| 2014 | $4,478 | $294,367 | $154,570 | $139,797 |
Source: Public Records
Map
Nearby Homes
- 19 Tarrant Ct
- 46 Laurel Glen Terrace
- 32 Picadilly Ct
- 9 Village Ct Unit 11
- 17 Woodstock Ct
- 1893 Lincoln Ave
- 5 Sequoia Rd
- 35 Village Cir
- 21 Red Rock Way
- 29 Red Rock Way
- 109 Boxwood Dr
- 0 Fair Dr Unit 325072555
- 57 Fair Dr
- 59 Fair Dr
- 40 Hacienda Ct
- 221 Spindle Ct
- 0 Chula Vista Dr Unit 325048501
- 0 Chula Vista Dr Unit 325048505
- 0 Chula Vista Dr Unit 325048499
- 0 Chula Vista Dr Unit 325048503
- 23 Tarrant Ct
- 5 Tarrant Ct
- 21 Tarrant Ct
- 15 Tarrant Ct
- 21 San Pablo Ave
- 10 San Pablo Ave
- 16 San Pablo Ave
- 8 Tarrant Ct
- 25 San Pablo Ave
- 10 Tarrant Ct
- 12 Tarrant Ct
- 27 San Pablo Ave
- 38 Merrydale Rd
- 17 Laurel Glen Terrace
- 13 Laurel Glen Terrace
- 9 Laurel Glen Terrace
- 22 San Pablo Ave
- 5 Laurel Glen Terrace
- 7 Merrydale Rd
- 11 Merrydale Rd