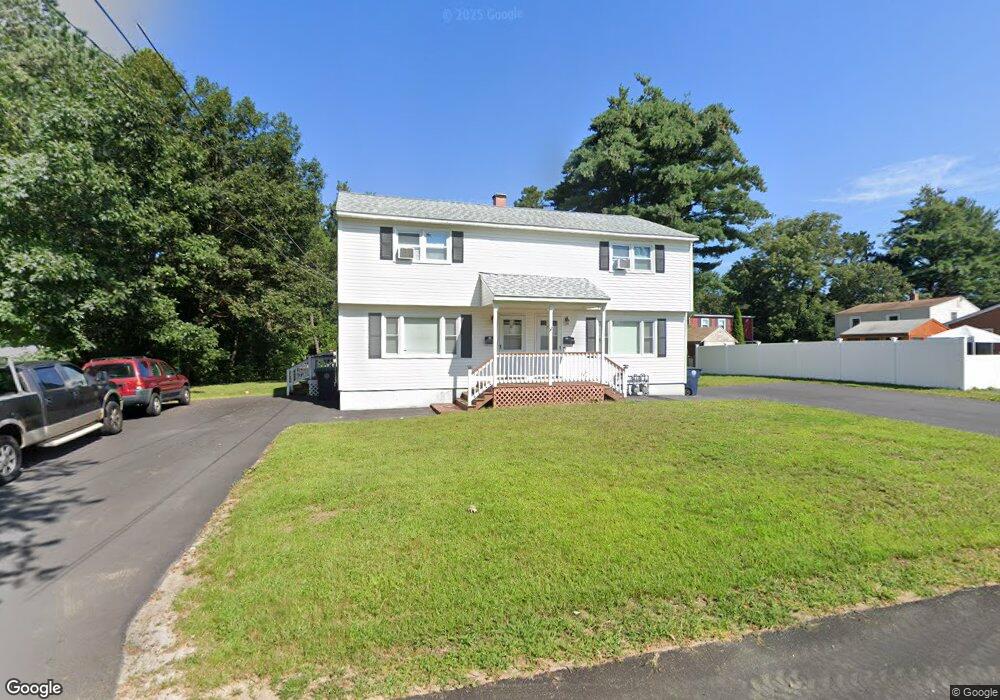
25 Thorndike St Unit 27 Nashua, NH 03060
South End Nashua NeighborhoodEstimated Value: $507,000 - $566,000
4
Beds
2
Baths
2,120
Sq Ft
$258/Sq Ft
Est. Value
About This Home
This home is located at 25 Thorndike St Unit 27, Nashua, NH 03060 and is currently estimated at $547,943, approximately $258 per square foot. 25 Thorndike St Unit 27 is a home located in Hillsborough County with nearby schools including Fairgrounds Elementary School, Fairgrounds Middle School, and Nashua High School South.
Ownership History
Date
Name
Owned For
Owner Type
Purchase Details
Closed on
Feb 22, 2021
Sold by
Soares Peter T
Bought by
Soares Peter and Soares Fernanda
Current Estimated Value
Home Financials for this Owner
Home Financials are based on the most recent Mortgage that was taken out on this home.
Original Mortgage
$249,900
Outstanding Balance
$214,416
Interest Rate
2.7%
Mortgage Type
New Conventional
Estimated Equity
$333,527
Purchase Details
Closed on
Jun 12, 1968
Bought by
Courtemanche Robert L
Create a Home Valuation Report for This Property
The Home Valuation Report is an in-depth analysis detailing your home's value as well as a comparison with similar homes in the area
Home Values in the Area
Average Home Value in this Area
Purchase History
| Date | Buyer | Sale Price | Title Company |
|---|---|---|---|
| Soares Peter | -- | None Available | |
| Courtemanche Robert L | -- | -- |
Source: Public Records
Mortgage History
| Date | Status | Borrower | Loan Amount |
|---|---|---|---|
| Open | Soares Peter | $249,900 |
Source: Public Records
Tax History Compared to Growth
Tax History
| Year | Tax Paid | Tax Assessment Tax Assessment Total Assessment is a certain percentage of the fair market value that is determined by local assessors to be the total taxable value of land and additions on the property. | Land | Improvement |
|---|---|---|---|---|
| 2024 | $7,964 | $500,900 | $156,800 | $344,100 |
| 2023 | $7,403 | $406,100 | $125,300 | $280,800 |
| 2022 | $7,338 | $406,100 | $125,300 | $280,800 |
| 2021 | $6,151 | $264,900 | $83,600 | $181,300 |
| 2020 | $5,951 | $263,200 | $83,600 | $179,600 |
| 2019 | $5,727 | $263,200 | $83,600 | $179,600 |
| 2018 | $5,582 | $263,200 | $83,600 | $179,600 |
| 2017 | $5,290 | $205,100 | $76,700 | $128,400 |
| 2016 | $5,179 | $206,600 | $78,200 | $128,400 |
| 2015 | $5,068 | $206,600 | $78,200 | $128,400 |
| 2014 | $4,969 | $206,600 | $78,200 | $128,400 |
Source: Public Records
Map
Nearby Homes
- 97 Linwood St
- 63 Dexter St
- 22 Kern Dr
- 11 Bordeaux St
- 22 New Dunstable Rd Unit 132133
- 41 New Dunstable Rd Unit 371
- 169A W Hollis St Unit 193
- 4 Badger St
- 15 Lovell St Unit 3
- 15 Lovell St Unit 7
- 15 Lovell St Unit 10
- 22 Wilder St
- 6 Hayden St
- 8 Buck St Unit 10
- 30 Ledge St
- 29 Greenwood Dr
- 17 Herrick St
- 15 Learned St Unit 123
- 2 Wakefield Dr
- 38 Central St
- 23 Thorndike St
- 35 Almont St Unit 302
- 24 Thorndike St
- 31 Almont St Unit 18
- 37 Almont St
- 32 Almont St Unit 109
- 27 Almont St Unit 16
- 19 Thorndike St
- 30 Almont St Unit 107
- 40 Almont St Unit 117
- 41 Almont St
- 49 Blanchard St
- 43 Almont St Unit 25
- 23 Almont St
- 81 Monroe St
- 42 Almont St Unit 121
- 28.5 Almont St
- 28 1/2 Almont St
- 17 Thorndike St
- 79 Monroe St Unit 81