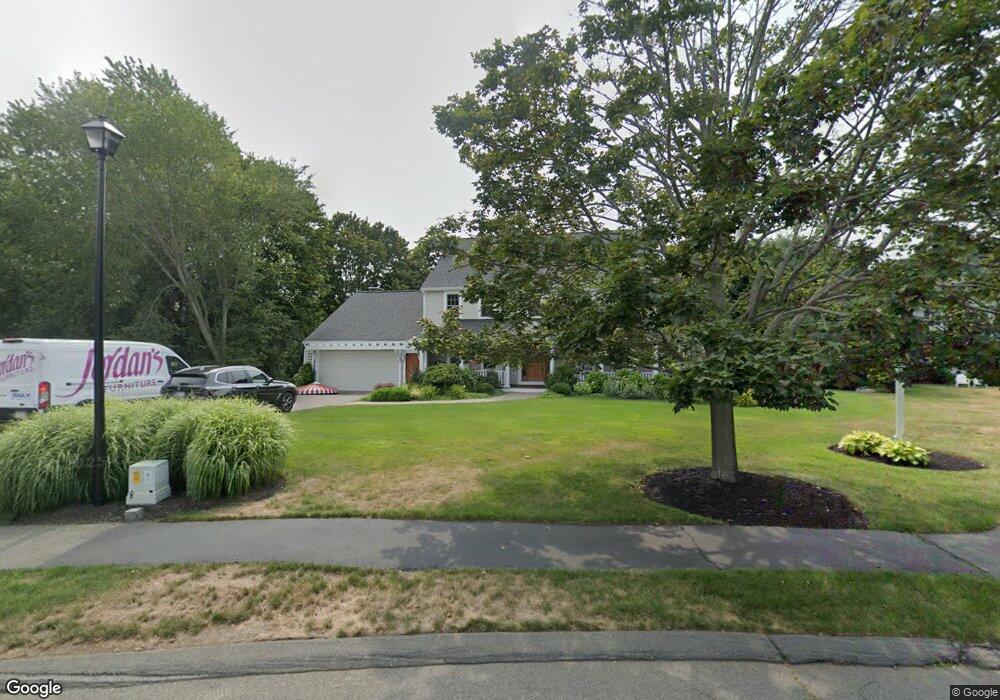
25 Thorpe Cir Danvers, MA 01923
Estimated Value: $1,063,000 - $1,136,000
4
Beds
3
Baths
2,450
Sq Ft
$448/Sq Ft
Est. Value
About This Home
This home is located at 25 Thorpe Cir, Danvers, MA 01923 and is currently estimated at $1,097,258, approximately $447 per square foot. 25 Thorpe Cir is a home located in Essex County with nearby schools including North Shore Christian School, St. Mary of the Annunciation School, and Waldorf School at Moraine Farm.
Ownership History
Date
Name
Owned For
Owner Type
Purchase Details
Closed on
Dec 14, 2020
Sold by
Leblanc Joy A
Bought by
Joy A Leblanc T A and Joy Leblanc
Current Estimated Value
Purchase Details
Closed on
Apr 23, 2020
Sold by
Leblanc Thorpe Circle Rt
Bought by
Leblanc Joy A
Home Financials for this Owner
Home Financials are based on the most recent Mortgage that was taken out on this home.
Original Mortgage
$175,000
Interest Rate
3.5%
Mortgage Type
New Conventional
Purchase Details
Closed on
Jul 1, 1994
Sold by
Pelletier Eugene and Pelletier Stacia
Bought by
Leblanc Michael R and Leblanc Joy A
Home Financials for this Owner
Home Financials are based on the most recent Mortgage that was taken out on this home.
Original Mortgage
$160,000
Interest Rate
8.55%
Mortgage Type
Purchase Money Mortgage
Create a Home Valuation Report for This Property
The Home Valuation Report is an in-depth analysis detailing your home's value as well as a comparison with similar homes in the area
Home Values in the Area
Average Home Value in this Area
Purchase History
| Date | Buyer | Sale Price | Title Company |
|---|---|---|---|
| Joy A Leblanc T A | -- | None Available | |
| Leblanc Joy A | -- | None Available | |
| Leblanc Michael R | $271,000 | -- |
Source: Public Records
Mortgage History
| Date | Status | Borrower | Loan Amount |
|---|---|---|---|
| Previous Owner | Leblanc Joy A | $175,000 | |
| Previous Owner | Leblanc Michael R | $222,000 | |
| Previous Owner | Leblanc Michael R | $227,000 | |
| Previous Owner | Leblanc Michael R | $227,000 | |
| Previous Owner | Leblanc Michael R | $160,000 |
Source: Public Records
Tax History Compared to Growth
Tax History
| Year | Tax Paid | Tax Assessment Tax Assessment Total Assessment is a certain percentage of the fair market value that is determined by local assessors to be the total taxable value of land and additions on the property. | Land | Improvement |
|---|---|---|---|---|
| 2025 | $11,197 | $1,018,800 | $424,700 | $594,100 |
| 2024 | $10,741 | $966,800 | $398,900 | $567,900 |
| 2023 | $10,156 | $864,300 | $360,300 | $504,000 |
| 2022 | $9,168 | $724,200 | $308,900 | $415,300 |
| 2021 | $8,802 | $659,300 | $296,000 | $363,300 |
| 2020 | $8,305 | $635,900 | $281,800 | $354,100 |
| 2019 | $7,817 | $588,600 | $244,500 | $344,100 |
| 2018 | $7,653 | $565,200 | $244,500 | $320,700 |
| 2017 | $7,711 | $543,400 | $244,500 | $298,900 |
| 2016 | $7,600 | $535,200 | $244,500 | $290,700 |
| 2015 | $7,451 | $499,700 | $225,200 | $274,500 |
Source: Public Records
Map
Nearby Homes
- 4 Brookvale Dr
- 42 Coolidge Rd
- 100 Poplar St
- 12 Exeter St
- 4 Wayside Dr
- 81 Elliott St
- 35 Locust St Unit 3
- 4 Butler Ave
- 38 High St Unit 4
- 117 Elliott St
- 35 High St Unit 3D
- 6 Colby Rd
- 5 Beacon St
- 8 Putnam St Unit 3
- 25 Cherry St Unit 3
- 11 Holten St
- 39 Trask St
- 20 Ash St Unit 3
- 20 Ash St Unit 1
- 14 1/2 Hampshire St