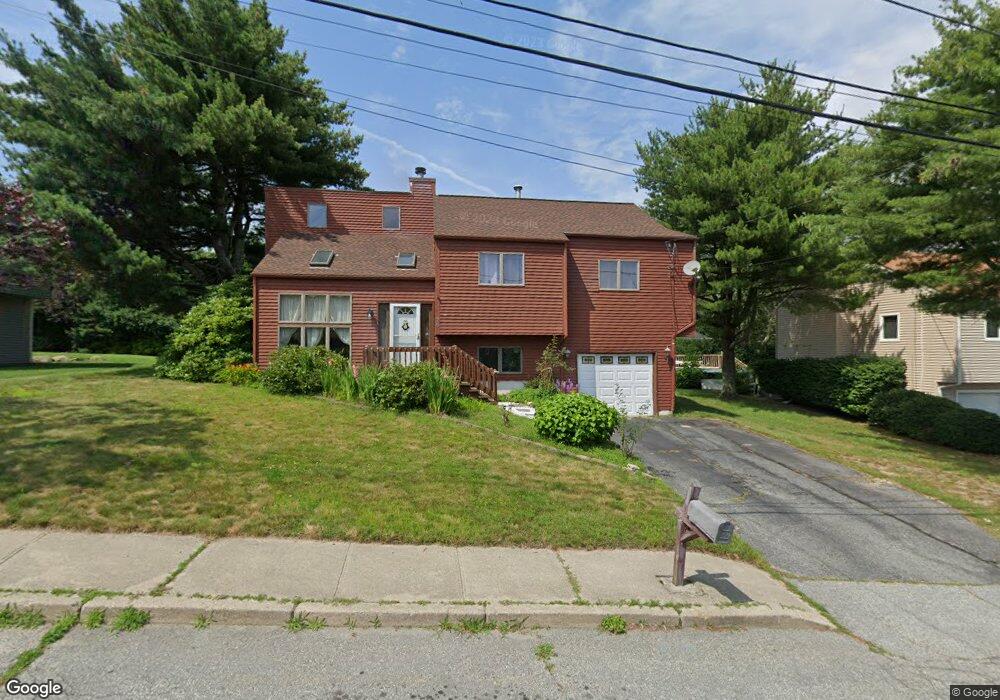
25 Valley View Dr Cranston, RI 02921
Oaklawn NeighborhoodEstimated Value: $432,000 - $545,000
3
Beds
2
Baths
1,195
Sq Ft
$410/Sq Ft
Est. Value
About This Home
This home is located at 25 Valley View Dr, Cranston, RI 02921 and is currently estimated at $489,391, approximately $409 per square foot. 25 Valley View Dr is a home located in Providence County with nearby schools including Oak Lawn School, Western Hills Middle School, and Cranston High School West.
Ownership History
Date
Name
Owned For
Owner Type
Purchase Details
Closed on
Oct 10, 2025
Sold by
Thadavong Sengkeo
Bought by
Thadavong Sengphet
Current Estimated Value
Purchase Details
Closed on
Jun 23, 2008
Sold by
Deutsche Bank Natl T C
Bought by
Thadavong Sengkeo and Thadavong Sengphet
Purchase Details
Closed on
May 27, 2008
Sold by
Hebert Anthony S
Bought by
Deutsche Bank Natl T C
Purchase Details
Closed on
Jan 8, 2004
Sold by
Cocozza Linda
Bought by
Hebert Anthony
Purchase Details
Closed on
Mar 1, 1989
Sold by
Jgp Bldrs Inc
Bought by
Cocozza James J
Create a Home Valuation Report for This Property
The Home Valuation Report is an in-depth analysis detailing your home's value as well as a comparison with similar homes in the area
Home Values in the Area
Average Home Value in this Area
Purchase History
| Date | Buyer | Sale Price | Title Company |
|---|---|---|---|
| Thadavong Sengphet | -- | -- | |
| Thadavong Sengkeo | $240,000 | -- | |
| Deutsche Bank Natl T C | $247,500 | -- | |
| Hebert Anthony | $283,000 | -- | |
| Cocozza James J | $150,000 | -- |
Source: Public Records
Mortgage History
| Date | Status | Borrower | Loan Amount |
|---|---|---|---|
| Previous Owner | Cocozza James J | $212,000 | |
| Previous Owner | Cocozza James J | $25,000 |
Source: Public Records
Tax History
| Year | Tax Paid | Tax Assessment Tax Assessment Total Assessment is a certain percentage of the fair market value that is determined by local assessors to be the total taxable value of land and additions on the property. | Land | Improvement |
|---|---|---|---|---|
| 2025 | $5,348 | $385,300 | $151,200 | $234,100 |
| 2024 | $5,244 | $385,300 | $151,200 | $234,100 |
| 2023 | $5,129 | $271,400 | $108,200 | $163,200 |
| 2022 | $5,024 | $271,400 | $108,200 | $163,200 |
| 2021 | $4,885 | $271,400 | $108,200 | $163,200 |
| 2020 | $5,712 | $275,000 | $108,200 | $166,800 |
| 2019 | $5,712 | $275,000 | $108,200 | $166,800 |
| 2018 | $5,580 | $275,000 | $108,200 | $166,800 |
| 2017 | $5,478 | $238,800 | $92,700 | $146,100 |
| 2016 | $5,361 | $238,800 | $92,700 | $146,100 |
| 2015 | $5,361 | $238,800 | $92,700 | $146,100 |
| 2014 | $5,297 | $231,900 | $88,900 | $143,000 |
Source: Public Records
Map
Nearby Homes
- 50 Briarwood Rd
- 6 Governors Hill Unit 6
- 42 Woodland Dr
- 1027 Providence St Unit 4B
- 14 Amanda St
- 0 Natick Rd
- 48 Governors Hill
- 52 Cottonwood Dr
- 63 Governors Hill Unit 63
- 61 High View Dr
- 33 Rose Hill Dr
- 1715 Phenix Ave
- 78 Wilbur Ave
- 20 Hilltop Dr
- 8 Ashton Ct
- 15 Gilcrest Dr
- 25 Wilson St
- 550 Wakefield St Unit 2
- 74 Cardinal Rd
- 64 Cardinal Rd
Your Personal Tour Guide
Ask me questions while you tour the home.