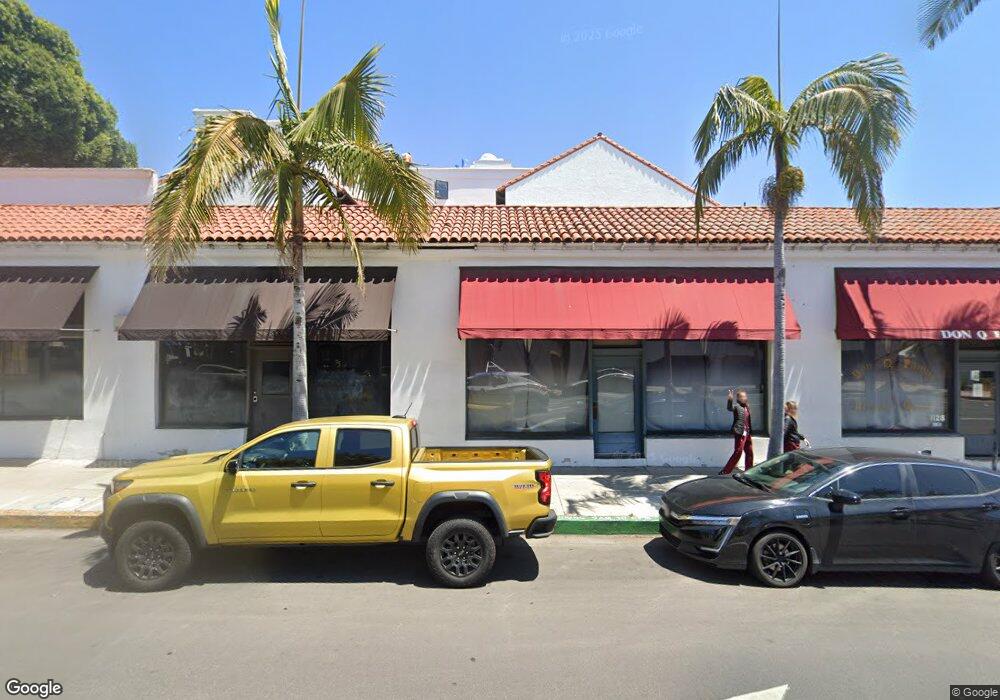
25 W Anapamu St Unit Suite C Santa Barbara, CA 93101
Downtown Santa Barbara NeighborhoodEstimated Value: $4,692,509
--
Bed
3
Baths
--
Sq Ft
5,663
Sq Ft Lot
About This Home
This home is located at 25 W Anapamu St Unit Suite C, Santa Barbara, CA 93101 and is currently estimated at $4,692,509. 25 W Anapamu St Unit Suite C is a home located in Santa Barbara County with nearby schools including Santa Barbara Junior High School, Santa Barbara Senior High School, and Peabody Charter School.
Ownership History
Date
Name
Owned For
Owner Type
Purchase Details
Closed on
Apr 28, 2017
Sold by
Cavaletto Catherine G
Bought by
25 West Anapamu Llc
Current Estimated Value
Purchase Details
Closed on
Dec 14, 2012
Sold by
25 West Llc
Bought by
Cavaletto Catherine G and Villines Cecilia E
Purchase Details
Closed on
Oct 23, 2012
Sold by
Cavaletto Mary Louisie
Bought by
Cavaletto Michael J
Purchase Details
Closed on
Feb 2, 2010
Sold by
Porter Alan R
Bought by
25 West Llc
Purchase Details
Closed on
Sep 6, 2006
Sold by
Mosby John M
Bought by
Porter Alan R
Purchase Details
Closed on
Jul 6, 1998
Sold by
Mosby John and Mosby Marilyn
Bought by
Mosby John M and Mosby Marilyn J
Purchase Details
Closed on
Apr 1, 1998
Sold by
Micheltorena Ltd
Bought by
1129 State Street
Create a Home Valuation Report for This Property
The Home Valuation Report is an in-depth analysis detailing your home's value as well as a comparison with similar homes in the area
Home Values in the Area
Average Home Value in this Area
Purchase History
| Date | Buyer | Sale Price | Title Company |
|---|---|---|---|
| 25 West Anapamu Llc | -- | None Available | |
| Cavaletto Catherine G | $3,475,000 | Fidelity National Title Co | |
| Cavaletto Michael J | -- | Fidelity National Title Comp | |
| 25 West Llc | $1,933,000 | Fidelity National Title Co | |
| Porter Alan R | -- | First American Title Company | |
| Mosby John M | -- | -- | |
| 1129 State Street | -- | Chicago Title |
Source: Public Records
Tax History Compared to Growth
Tax History
| Year | Tax Paid | Tax Assessment Tax Assessment Total Assessment is a certain percentage of the fair market value that is determined by local assessors to be the total taxable value of land and additions on the property. | Land | Improvement |
|---|---|---|---|---|
| 2025 | $48,038 | $4,279,206 | $1,046,710 | $3,232,496 |
| 2023 | $48,038 | $4,113,041 | $1,006,066 | $3,106,975 |
| 2022 | $42,868 | $4,032,394 | $986,340 | $3,046,054 |
| 2021 | $41,886 | $3,953,328 | $967,000 | $2,986,328 |
| 2020 | $41,455 | $3,912,792 | $957,085 | $2,955,707 |
| 2019 | $40,733 | $3,836,071 | $938,319 | $2,897,752 |
| 2018 | $40,158 | $3,760,855 | $919,921 | $2,840,934 |
| 2017 | $38,832 | $3,687,114 | $901,884 | $2,785,230 |
| 2016 | $37,785 | $3,614,818 | $884,200 | $2,730,618 |
| 2015 | $37,370 | $3,560,521 | $870,919 | $2,689,602 |
| 2014 | -- | $3,490,776 | $853,859 | $2,636,917 |
Source: Public Records
Map
Nearby Homes
- 1221 Chapala St
- 136 W Figueroa St
- 1035 De la Vina St
- 220 W Figueroa St
- 309 W Victoria St
- 1416 Bath St
- 215 E Victoria St
- 103 E Micheltorena St
- 330 W Canon Perdido St
- 105 W De la Guerra St Unit S
- 1018 Garden St Unit 13
- 1018 Garden St Unit 12
- 1018 Garden St Unit 9
- 1018 Garden St Unit 8
- 1018 Garden St Unit 7
- 1018 Garden St Unit 4
- 27 E Arrellaga St
- 21 E Arrellaga St
- 333 E Anapamu St
- 1221 Laguna St
- 25 W Anapamu St Unit B
- 25 W Anapamu St Unit Suite B
- 25 W Anapamu St
- 27 W Anapamu St
- 29 W Anapamu St Unit 2nd & 3rd Floors
- 29 W Anapamu St Unit 2nd Floor
- 29 W Anapamu St Unit Basement
- 29 W Anapamu St
- 29 W Anapamu St Unit Entire Building
- 29 W Anapamu St Unit Penthouse
- 29 W Anapamu St Unit 302
- 29 W Anapamu St Unit 301
- 29 W Anapamu St Unit 201
- 29 W Anapamu St Unit 102
- 29 W Anapamu St Unit 202
- 29 W Anapamu St Unit 101
- 21 & 23 W Anapamu St
- 24 W Anapamu Ph St St
- 24 W Anapamu Ph St
- 10 W Anapamu St