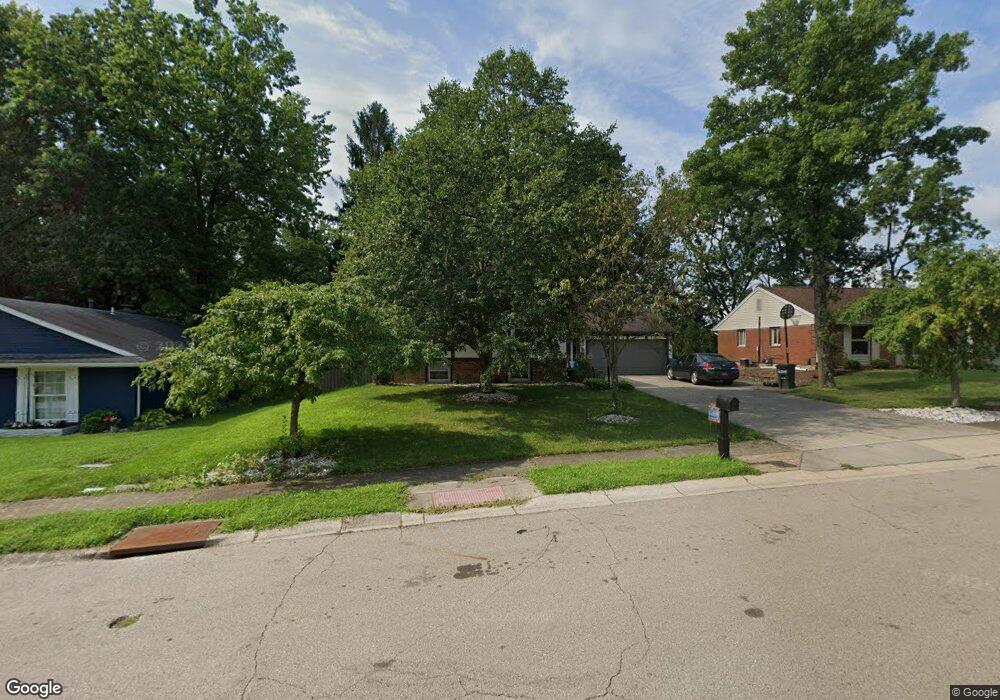
25 Whispering Pines St Springboro, OH 45066
Estimated Value: $364,000 - $434,000
4
Beds
4
Baths
1,264
Sq Ft
$307/Sq Ft
Est. Value
About This Home
This home is located at 25 Whispering Pines St, Springboro, OH 45066 and is currently estimated at $387,519, approximately $306 per square foot. 25 Whispering Pines St is a home located in Warren County with nearby schools including Clearcreek Elementary School, Springboro Intermediate School, and Dennis Elementary School.
Ownership History
Date
Name
Owned For
Owner Type
Purchase Details
Closed on
Nov 16, 2020
Sold by
Kelly Dennis B and Kelly Pam
Bought by
Ferguson Christina
Current Estimated Value
Home Financials for this Owner
Home Financials are based on the most recent Mortgage that was taken out on this home.
Original Mortgage
$269,325
Outstanding Balance
$239,661
Interest Rate
2.8%
Mortgage Type
New Conventional
Estimated Equity
$147,858
Purchase Details
Closed on
Apr 23, 2002
Sold by
Galloway James E
Bought by
Kelly Dennis B
Home Financials for this Owner
Home Financials are based on the most recent Mortgage that was taken out on this home.
Original Mortgage
$126,800
Interest Rate
6.93%
Mortgage Type
New Conventional
Create a Home Valuation Report for This Property
The Home Valuation Report is an in-depth analysis detailing your home's value as well as a comparison with similar homes in the area
Home Values in the Area
Average Home Value in this Area
Purchase History
| Date | Buyer | Sale Price | Title Company |
|---|---|---|---|
| Ferguson Christina | $283,500 | None Available | |
| Kelly Dennis B | $158,500 | -- |
Source: Public Records
Mortgage History
| Date | Status | Borrower | Loan Amount |
|---|---|---|---|
| Open | Ferguson Christina | $269,325 | |
| Previous Owner | Kelly Dennis B | $126,800 |
Source: Public Records
Tax History Compared to Growth
Tax History
| Year | Tax Paid | Tax Assessment Tax Assessment Total Assessment is a certain percentage of the fair market value that is determined by local assessors to be the total taxable value of land and additions on the property. | Land | Improvement |
|---|---|---|---|---|
| 2024 | $4,626 | $118,460 | $26,250 | $92,210 |
| 2023 | $4,037 | $94,804 | $16,520 | $78,284 |
| 2022 | $3,977 | $94,805 | $16,520 | $78,285 |
| 2021 | $3,702 | $94,805 | $16,520 | $78,285 |
| 2020 | $2,622 | $58,695 | $14,000 | $44,695 |
| 2019 | $2,417 | $58,695 | $14,000 | $44,695 |
| 2018 | $2,419 | $58,695 | $14,000 | $44,695 |
| 2017 | $2,223 | $48,605 | $11,771 | $36,834 |
| 2016 | $2,319 | $48,605 | $11,771 | $36,834 |
| 2015 | $2,324 | $48,605 | $11,771 | $36,834 |
| 2014 | $2,359 | $46,740 | $11,320 | $35,420 |
| 2013 | $2,358 | $57,810 | $14,000 | $43,810 |
Source: Public Records
Map
Nearby Homes
- 120 Clearview Dr
- 145 Cedar Hill Ln
- 180 Teakwood Ln
- 120 Bramblebush Ln
- 375 Tamarack Trail
- 420 Clearcreek Franklin Rd
- 450 Evergreen Dr
- 23 Pheasant Run Cir Unit 9A
- 145 Redbud Dr
- 510 Royal Springs Dr
- 150 Tanglewood Dr
- 20 Terradyne Trace
- 14 Ed Knoll Bend
- 45 Wadestone Ln
- 45 Wadestone St
- 15 Belvoir Ct
- 145 Woods Rd
- 40 Libby Hollow St
- 2649 Factory Rd
- 140 Dan Haven Place
- 25 Whispering Pines
- 35 Whispering Pines St
- 15 Whispering Pines St
- 45 Whispering Pines St
- 40 Whispering Pines St
- 10 Evergreen Dr
- 110 Pinecone Dr
- 50 Whispering Pines St
- 3 Whispering Pines St
- 100 Evergreen Dr
- 120 Pinecone Dr
- 125 Pinecone Ln
- 125 Pinecone Dr
- 1 Whispering Pines
- 1 Whispering Pines St
- 110 Evergreen Dr
- 30 Whispering Pines St
- 130 Pinecone Dr
- 135 Pinecone Ln
- 135 Pinecone Dr