Estimated Value: $106,609 - $128,000
--
Bed
1
Bath
804
Sq Ft
$148/Sq Ft
Est. Value
About This Home
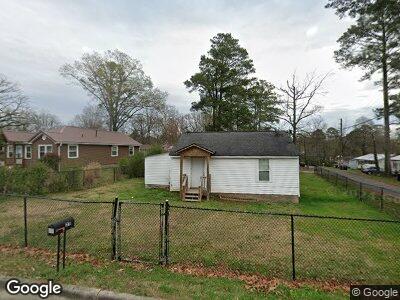
This home is located at 25 Wingfield St SW, Rome, GA 30165 and is currently estimated at $118,902, approximately $147 per square foot. 25 Wingfield St SW is a home located in Floyd County with nearby schools including Rome High School and St. Mary School.
Ownership History
Date
Name
Owned For
Owner Type
Purchase Details
Closed on
Apr 11, 2000
Sold by
Munoz Israel and Norma Munoz
Bought by
Munoz Israel and Munoz Norma A
Current Estimated Value
Purchase Details
Closed on
Jun 21, 1995
Sold by
Schlesinger Steven
Bought by
Munoz Israel and Norma Munoz
Purchase Details
Closed on
Apr 11, 1995
Sold by
Greer Gary C and Greer Marsha R
Bought by
Schlesinger Steven
Purchase Details
Closed on
Mar 1, 1993
Sold by
Smith Dee Ann
Bought by
Greer Gary C and Greer Marsha R
Purchase Details
Closed on
Nov 17, 1992
Sold by
Smith Christephor D and Smith Dee
Bought by
Smith Dee Ann
Purchase Details
Closed on
Nov 4, 1988
Sold by
Greene Jenell S
Bought by
Smith Christephor D and Smith Dee
Purchase Details
Closed on
Nov 5, 1973
Sold by
Lewallen W D
Bought by
Greene Jenell S
Purchase Details
Closed on
Jan 2, 1901
Sold by
Mccrary Sara
Bought by
Lewallen W D
Purchase Details
Closed on
Jan 1, 1901
Bought by
Mccrary Sara
Create a Home Valuation Report for This Property
The Home Valuation Report is an in-depth analysis detailing your home's value as well as a comparison with similar homes in the area
Home Values in the Area
Average Home Value in this Area
Purchase History
| Date | Buyer | Sale Price | Title Company |
|---|---|---|---|
| Munoz Israel | -- | -- | |
| Munoz Israel | $32,500 | -- | |
| Schlesinger Steven | $18,800 | -- | |
| Greer Gary C | $15,500 | -- | |
| Smith Dee Ann | -- | -- | |
| Smith Christephor D | $12,000 | -- | |
| Greene Jenell S | -- | -- | |
| Lewallen W D | -- | -- | |
| Mccrary Sara | -- | -- |
Source: Public Records
Tax History Compared to Growth
Tax History
| Year | Tax Paid | Tax Assessment Tax Assessment Total Assessment is a certain percentage of the fair market value that is determined by local assessors to be the total taxable value of land and additions on the property. | Land | Improvement |
|---|---|---|---|---|
| 2024 | $848 | $35,181 | $6,914 | $28,267 |
| 2023 | $813 | $33,136 | $6,146 | $26,990 |
| 2022 | $738 | $27,324 | $5,122 | $22,202 |
| 2021 | $706 | $24,886 | $5,122 | $19,764 |
| 2020 | $668 | $22,435 | $3,841 | $18,594 |
| 2019 | $643 | $21,266 | $3,841 | $17,425 |
| 2018 | $622 | $20,097 | $3,841 | $16,256 |
| 2017 | $610 | $19,406 | $3,841 | $15,565 |
| 2016 | $604 | $18,977 | $3,840 | $15,137 |
| 2015 | $575 | $18,977 | $3,840 | $15,137 |
| 2014 | $575 | $18,977 | $3,840 | $15,137 |
Source: Public Records
Map
Nearby Homes
- 103 Wooten Dr SW
- 10 Wingfield St SW
- 10 Leon St SW
- 20 Burnett Ferry Rd SW
- 3 Pebble Bend Ct
- 104 Dellwood Dr NW
- 0 Cedartown Rd Unit 10479932
- 0 Lexington Ln Unit 7312028
- 0 Lexington Ln Unit 10133164
- 438 Wilkerson Rd SW
- 7 Texas Ave NW
- 122 Payne Rd SW
- 107 Kirton St NW
- 123 Nanellen Rd SW
- 813 Oakland Ave SW
- 101 Garrard Ave NW
- 43 Westwood Cir SW
- 2 Castlewood Dr SW
- 7 Hawk Spring Dr SW
- 0 E Clinton Dr SW Unit 7497950
- 25 Wingfield St SW
- 23 Wingfield St SW
- 21 Wingfield St SW
- 21 Wallace St SW
- 28 Wingfield St SW
- 30 Wingfield St SW
- 0 Wingfield St SW Unit 7108502
- 0 Wingfield St SW Unit 3276339
- 0 Wingfield St SW Unit 3196752
- 0 Wingfield St SW Unit 8236501
- 0 Wingfield St SW Unit 8029625
- 0 Wingfield St SW
- 26 Wingfield St SW
- 19 Wallace St SW
- 22 Wallace St SW Unit 26
- 4 Pineway Dr SW
- 19 Wingfield St SW
- 100 Wingfield St SW
- 17 Wallace St SW
- 103 Whitehead St SW