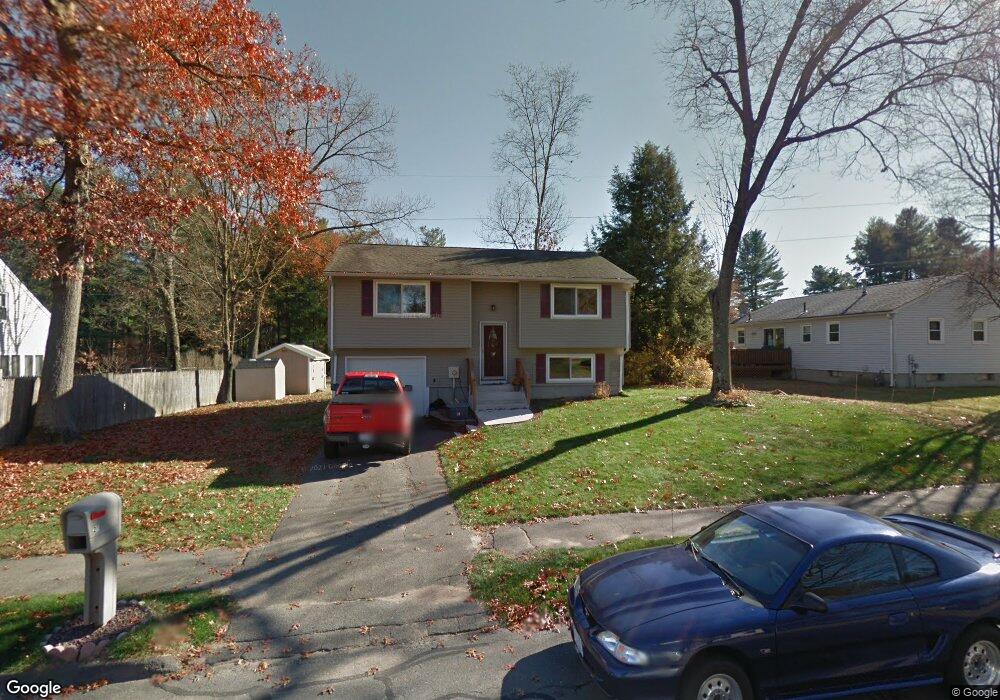
25 Zabek Dr Easthampton, MA 01027
Estimated Value: $314,000 - $379,000
3
Beds
3
Baths
928
Sq Ft
$377/Sq Ft
Est. Value
About This Home
This home is located at 25 Zabek Dr, Easthampton, MA 01027 and is currently estimated at $349,511, approximately $376 per square foot. 25 Zabek Dr is a home located in Hampshire County with nearby schools including Easthampton High School, Calvary Baptist Christian School, and Tri-County Schools.
Ownership History
Date
Name
Owned For
Owner Type
Purchase Details
Closed on
Jun 11, 2013
Sold by
Piekarski Roger H
Bought by
Piekarski Roger H and Piekarski Christopher R
Current Estimated Value
Purchase Details
Closed on
Jan 9, 2001
Sold by
Pelletier Michelle L
Bought by
Piekarski Roger H
Home Financials for this Owner
Home Financials are based on the most recent Mortgage that was taken out on this home.
Original Mortgage
$52,544
Interest Rate
7.69%
Mortgage Type
Purchase Money Mortgage
Purchase Details
Closed on
May 8, 1995
Sold by
Cooper David M and Cooper Tina M
Bought by
Piekarski Roger H
Home Financials for this Owner
Home Financials are based on the most recent Mortgage that was taken out on this home.
Original Mortgage
$71,000
Interest Rate
8.36%
Mortgage Type
Purchase Money Mortgage
Create a Home Valuation Report for This Property
The Home Valuation Report is an in-depth analysis detailing your home's value as well as a comparison with similar homes in the area
Home Values in the Area
Average Home Value in this Area
Purchase History
| Date | Buyer | Sale Price | Title Company |
|---|---|---|---|
| Piekarski Roger H | -- | -- | |
| Piekarski Roger H | $2,500 | -- | |
| Piekarski Roger H | $89,000 | -- |
Source: Public Records
Mortgage History
| Date | Status | Borrower | Loan Amount |
|---|---|---|---|
| Previous Owner | Piekarski Roger H | $52,544 | |
| Previous Owner | Piekarski Roger H | $68,000 | |
| Previous Owner | Piekarski Roger H | $71,000 | |
| Previous Owner | Piekarski Roger H | $10,149 |
Source: Public Records
Tax History
| Year | Tax Paid | Tax Assessment Tax Assessment Total Assessment is a certain percentage of the fair market value that is determined by local assessors to be the total taxable value of land and additions on the property. | Land | Improvement |
|---|---|---|---|---|
| 2025 | $4,102 | $300,100 | $112,500 | $187,600 |
| 2024 | $3,957 | $291,800 | $109,200 | $182,600 |
| 2023 | $3,034 | $207,100 | $85,900 | $121,200 |
| 2022 | $3,423 | $207,100 | $85,900 | $121,200 |
| 2021 | $3,743 | $213,400 | $85,900 | $127,500 |
| 2020 | $3,678 | $207,100 | $85,900 | $121,200 |
| 2019 | $3,197 | $206,800 | $85,900 | $120,900 |
| 2018 | $3,072 | $192,000 | $81,100 | $110,900 |
| 2017 | $3,004 | $185,300 | $78,100 | $107,200 |
| 2016 | $2,889 | $185,300 | $78,100 | $107,200 |
| 2015 | $2,807 | $185,300 | $78,100 | $107,200 |
Source: Public Records
Map
Nearby Homes
Your Personal Tour Guide
Ask me questions while you tour the home.