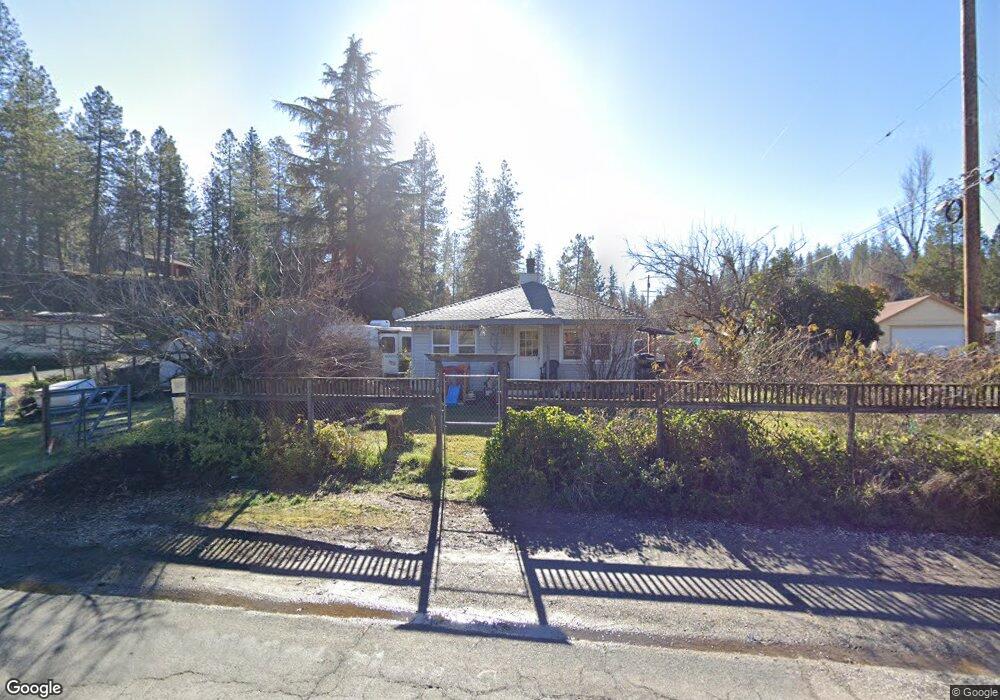
250 E Weimar Cross Rd Colfax, CA 95713
Estimated Value: $332,412 - $389,000
2
Beds
1
Bath
1,186
Sq Ft
$310/Sq Ft
Est. Value
About This Home
This home is located at 250 E Weimar Cross Rd, Colfax, CA 95713 and is currently estimated at $367,853, approximately $310 per square foot. 250 E Weimar Cross Rd is a home located in Placer County with nearby schools including Weimar Hills, Sierra Hills Elementary School, and Colfax High School.
Ownership History
Date
Name
Owned For
Owner Type
Purchase Details
Closed on
Aug 28, 1998
Sold by
Mcguire Ronald L and Mcguire Carrie A
Bought by
Mcguire Ronald L and Mcguire Carrie
Current Estimated Value
Home Financials for this Owner
Home Financials are based on the most recent Mortgage that was taken out on this home.
Original Mortgage
$120,349
Outstanding Balance
$25,730
Interest Rate
6.91%
Mortgage Type
FHA
Estimated Equity
$342,123
Purchase Details
Closed on
Aug 15, 1995
Sold by
Mcnulty Karen
Bought by
Ehrmann Daniel P
Home Financials for this Owner
Home Financials are based on the most recent Mortgage that was taken out on this home.
Original Mortgage
$122,444
Interest Rate
7.71%
Mortgage Type
FHA
Purchase Details
Closed on
Aug 11, 1995
Sold by
Ehrmann Daniel P
Bought by
Mcguire Ronald L and Mcguire Carrie A
Home Financials for this Owner
Home Financials are based on the most recent Mortgage that was taken out on this home.
Original Mortgage
$122,444
Interest Rate
7.71%
Mortgage Type
FHA
Create a Home Valuation Report for This Property
The Home Valuation Report is an in-depth analysis detailing your home's value as well as a comparison with similar homes in the area
Home Values in the Area
Average Home Value in this Area
Purchase History
| Date | Buyer | Sale Price | Title Company |
|---|---|---|---|
| Mcguire Ronald L | -- | Old Republic Title Company | |
| Ehrmann Daniel P | -- | Placer Title Company | |
| Mcguire Ronald L | $125,000 | Placer Title Company |
Source: Public Records
Mortgage History
| Date | Status | Borrower | Loan Amount |
|---|---|---|---|
| Open | Mcguire Ronald L | $120,349 | |
| Closed | Mcguire Ronald L | $122,444 |
Source: Public Records
Tax History
| Year | Tax Paid | Tax Assessment Tax Assessment Total Assessment is a certain percentage of the fair market value that is determined by local assessors to be the total taxable value of land and additions on the property. | Land | Improvement |
|---|---|---|---|---|
| 2025 | $2,454 | $207,621 | $83,046 | $124,575 |
| 2023 | $2,454 | $199,561 | $79,822 | $119,739 |
| 2022 | $2,358 | $195,649 | $78,257 | $117,392 |
| 2021 | $2,300 | $191,814 | $76,723 | $115,091 |
| 2020 | $2,266 | $189,848 | $75,937 | $113,911 |
| 2019 | $2,217 | $186,127 | $74,449 | $111,678 |
| 2018 | $1,960 | $182,479 | $72,990 | $109,489 |
| 2017 | $1,921 | $178,902 | $71,559 | $107,343 |
| 2016 | $1,878 | $175,395 | $70,156 | $105,239 |
| 2015 | $1,831 | $172,762 | $69,103 | $103,659 |
| 2014 | $1,802 | $169,379 | $67,750 | $101,629 |
Source: Public Records
Map
Nearby Homes
- 20920 Sunset Way
- 135 Ponderosa Way Unit 7
- 135 Ponderosa Way Unit 14
- 135 Ponderosa Way Unit 30
- 135 Ponderosa Way Unit 2
- 525 Deerborne Ct
- 20335 Montana Ln
- 717 Swanson Ln
- 0 Forest Lake Place Unit 226017031
- 0 Forest Lake Place Unit 226016409
- 0 Forest Lake Place Unit 226017447
- 1149 Swanson Ln
- 21495 Snooks Rd
- 870 Swanson Ln
- 0 Natures Way
- 21465 Mason Rd
- 20790 Indian Dr
- 21895 One Fine Place
- 1500 Live Oak Rd
- 2 Eden Forest Dr
- 230 E Weimar Cross Rd
- 260 E Weimar Cross Rd
- 20950 Sunset Way
- 20955 Sunset Way
- 200 E Weimar Cross Rd
- 20935 Sunset Way
- 280 E Weimar Cross Rd
- 275 E Weimar Cross Rd
- 20921 Sunset Way
- 21035 N Manzanita Hills Rd
- 20870 Sunset Way
- 110 E Weimar Cross Rd
- 65 Ponderosa Way
- 340 E Weimar Cross Rd
- 20820 Sunset Way
- 20933 Rail Way
- 21000 N Manzanita Hills Rd
- 21065 N Manzanita Hills Rd
- 20940 S Manzanita Hills Rd
- 91 E Weimar Cross Rd
Your Personal Tour Guide
Ask me questions while you tour the home.