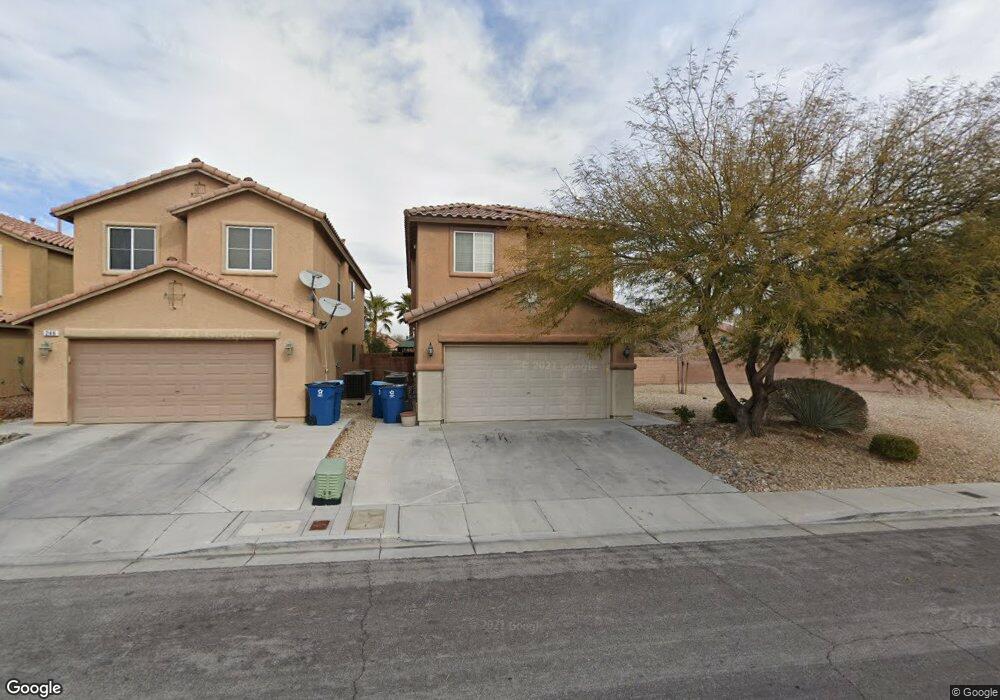
250 Lantana Breeze Dr Las Vegas, NV 89183
Silverado Ranch NeighborhoodEstimated Value: $433,404 - $462,000
4
Beds
3
Baths
2,014
Sq Ft
$224/Sq Ft
Est. Value
About This Home
This home is located at 250 Lantana Breeze Dr, Las Vegas, NV 89183 and is currently estimated at $450,351, approximately $223 per square foot. 250 Lantana Breeze Dr is a home located in Clark County with nearby schools including Steve Schorr Elementary School, Del E. Webb Middle School, and Liberty High School.
Ownership History
Date
Name
Owned For
Owner Type
Purchase Details
Closed on
Apr 24, 2018
Sold by
Tenorio Shannon
Bought by
Bobak Susan and Tenorio Shannon
Current Estimated Value
Purchase Details
Closed on
Apr 23, 2018
Sold by
Tenorio Shannon and Mestas Alice
Bought by
Tenorjo Sbannon
Purchase Details
Closed on
Jan 25, 2012
Sold by
Bobak Susan
Bought by
Tenorio Shannon and Mestas Alice
Home Financials for this Owner
Home Financials are based on the most recent Mortgage that was taken out on this home.
Original Mortgage
$87,000
Interest Rate
3.88%
Mortgage Type
New Conventional
Purchase Details
Closed on
Sep 13, 2006
Sold by
Kb Home Nevada Inc
Bought by
Bobak Susan
Home Financials for this Owner
Home Financials are based on the most recent Mortgage that was taken out on this home.
Original Mortgage
$276,000
Interest Rate
6.87%
Mortgage Type
Unknown
Create a Home Valuation Report for This Property
The Home Valuation Report is an in-depth analysis detailing your home's value as well as a comparison with similar homes in the area
Home Values in the Area
Average Home Value in this Area
Purchase History
| Date | Buyer | Sale Price | Title Company |
|---|---|---|---|
| Bobak Susan | $237,603 | None Available | |
| Tenorjo Sbannon | -- | None Available | |
| Tenorio Shannon | $147,000 | Ticor Title Las Vegas | |
| Bobak Susan | $345,000 | First Amer Title Co Of Nv |
Source: Public Records
Mortgage History
| Date | Status | Borrower | Loan Amount |
|---|---|---|---|
| Previous Owner | Tenorio Shannon | $87,000 | |
| Previous Owner | Bobak Susan | $276,000 |
Source: Public Records
Tax History Compared to Growth
Tax History
| Year | Tax Paid | Tax Assessment Tax Assessment Total Assessment is a certain percentage of the fair market value that is determined by local assessors to be the total taxable value of land and additions on the property. | Land | Improvement |
|---|---|---|---|---|
| 2025 | $2,308 | $125,835 | $39,200 | $86,635 |
| 2024 | $2,137 | $125,835 | $39,200 | $86,635 |
| 2023 | $1,423 | $115,706 | $33,950 | $81,756 |
| 2022 | $1,979 | $102,099 | $27,650 | $74,449 |
| 2021 | $1,833 | $95,923 | $25,200 | $70,723 |
| 2020 | $1,699 | $95,257 | $25,200 | $70,057 |
| 2019 | $1,592 | $90,608 | $22,050 | $68,558 |
| 2018 | $1,519 | $83,161 | $17,500 | $65,661 |
| 2017 | $2,421 | $82,533 | $16,100 | $66,433 |
| 2016 | $1,423 | $71,062 | $12,950 | $58,112 |
| 2015 | $1,420 | $53,117 | $9,450 | $43,667 |
| 2014 | $1,378 | $45,587 | $5,250 | $40,337 |
Source: Public Records
Map
Nearby Homes
- 218 Lantana Breeze Dr
- 11819 Bella Luna St
- 11668 Tierney Creek Dr
- 11771 Bergamo Ct
- 11609 Andorra St
- 11769 Elianto St
- 11862 Partenio Ct
- 11746 Magliana St
- 11560 S Stivali St
- 11934 Wild Chamomile St
- 326 E Neal Ave
- 104 Masserta Ct
- 11929 Haven St
- 178 Elexese Ct
- 69 Desert Palm Dr
- 72 Dark Creek Ave
- 68 Jewel Mine Ave
- 57 Foxworth Ct
- 124 Nola Stream Ct
- 11882 Snow Bank St
- 246 Lantana Breeze Dr
- 242 Lantana Breeze Dr
- 11756 Garland Grove Ln
- 238 Lantana Breeze Dr
- 253 Lantana Breeze Dr
- 249 Lantana Breeze Dr
- 257 Lantana Breeze Dr
- 245 Lantana Breeze Dr
- 241 Lantana Breeze Dr
- 261 Lantana Breeze Dr
- 11763 Fern Creek Ln
- 11752 Garland Grove Ln
- 11767 Fern Creek Ln
- 11759 Fern Creek Ln
- 11755 Fern Creek Ln
- 237 Lantana Breeze Dr
- 11751 Fern Creek Ln
- 226 Lantana Breeze Dr
- 11748 Garland Grove Ln
- 233 Lantana Breeze Dr