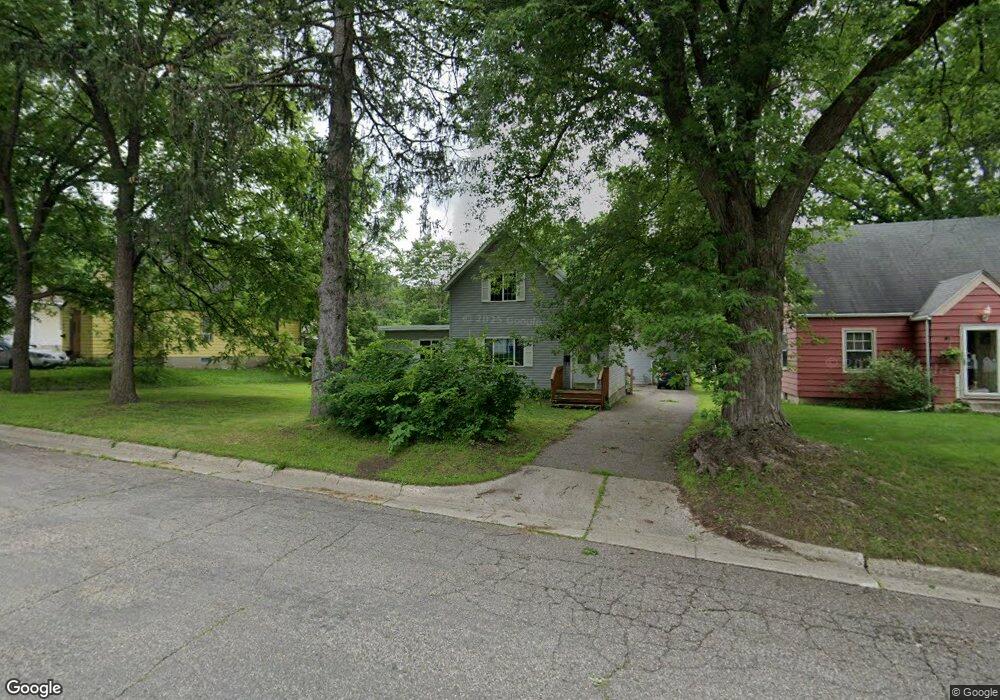
250 Linden Ave Owatonna, MN 55060
Estimated Value: $196,000 - $223,208
3
Beds
2
Baths
1,568
Sq Ft
$137/Sq Ft
Est. Value
About This Home
This home is located at 250 Linden Ave, Owatonna, MN 55060 and is currently estimated at $214,052, approximately $136 per square foot. 250 Linden Ave is a home located in Steele County with nearby schools including Washington Elementary School, Owatonna Middle School, and Owatonna Senior High School.
Ownership History
Date
Name
Owned For
Owner Type
Purchase Details
Closed on
Aug 11, 2020
Sold by
Medrano Luis R and Medrano Blanca
Bought by
Behne Sydney and Stowe Austin
Current Estimated Value
Home Financials for this Owner
Home Financials are based on the most recent Mortgage that was taken out on this home.
Original Mortgage
$8,000
Outstanding Balance
$7,083
Interest Rate
2.9%
Mortgage Type
Balloon
Estimated Equity
$206,969
Purchase Details
Closed on
Apr 30, 2019
Sold by
Johnson Dennis and Johnson Susan I
Bought by
Medrano Luis R
Home Financials for this Owner
Home Financials are based on the most recent Mortgage that was taken out on this home.
Original Mortgage
$127,645
Interest Rate
4.2%
Mortgage Type
FHA
Purchase Details
Closed on
Jun 21, 2010
Sold by
U S Bank National Association
Bought by
Johnson Dennis
Purchase Details
Closed on
Aug 25, 2009
Sold by
Hanneman Raynell M and Waldhauser Darin L
Bought by
U S Bank National Association
Create a Home Valuation Report for This Property
The Home Valuation Report is an in-depth analysis detailing your home's value as well as a comparison with similar homes in the area
Home Values in the Area
Average Home Value in this Area
Purchase History
| Date | Buyer | Sale Price | Title Company |
|---|---|---|---|
| Behne Sydney | $149,000 | North American Title | |
| Medrano Luis R | $130,000 | North American Title | |
| Johnson Dennis | $10,909 | None Available | |
| U S Bank National Association | $99,191 | None Available |
Source: Public Records
Mortgage History
| Date | Status | Borrower | Loan Amount |
|---|---|---|---|
| Open | Behne Sydney | $8,000 | |
| Open | Behne Sydney | $144,485 | |
| Previous Owner | Medrano Luis R | $127,645 |
Source: Public Records
Tax History Compared to Growth
Tax History
| Year | Tax Paid | Tax Assessment Tax Assessment Total Assessment is a certain percentage of the fair market value that is determined by local assessors to be the total taxable value of land and additions on the property. | Land | Improvement |
|---|---|---|---|---|
| 2025 | $2,408 | $179,500 | $25,300 | $154,200 |
| 2024 | $2,256 | $184,400 | $37,200 | $147,200 |
| 2023 | $2,266 | $166,300 | $29,800 | $136,500 |
| 2022 | $2,078 | $160,700 | $28,300 | $132,400 |
| 2021 | $1,364 | $136,024 | $26,852 | $109,172 |
| 2020 | $1,364 | $112,700 | $26,852 | $85,848 |
| 2019 | $1,552 | $94,668 | $26,852 | $67,816 |
| 2018 | $1,484 | $85,162 | $23,030 | $62,132 |
| 2017 | $1,398 | $80,850 | $19,208 | $61,642 |
| 2016 | $1,456 | $76,440 | $19,208 | $57,232 |
| 2015 | -- | $0 | $0 | $0 |
| 2014 | -- | $0 | $0 | $0 |
Source: Public Records
Map
Nearby Homes
- 246 Beech Ave
- 70 Aspen Highland Place
- 510 Maple Dr
- 808 Cherry St
- 531 E Main St
- 525 E Main St
- 358 E Main St
- 316 E Pearl St
- 527 E Academy St
- 611 NE Mineral Sp Rd
- 516 E School St
- 244 E Fremont St
- 231 E Pearl St
- 1130 E School St
- 613 E University St
- 13 Augusta Place
- 649 Woodhill Place
- 248 E School St
- 604 Prospect St
- 5 Carriage Ln