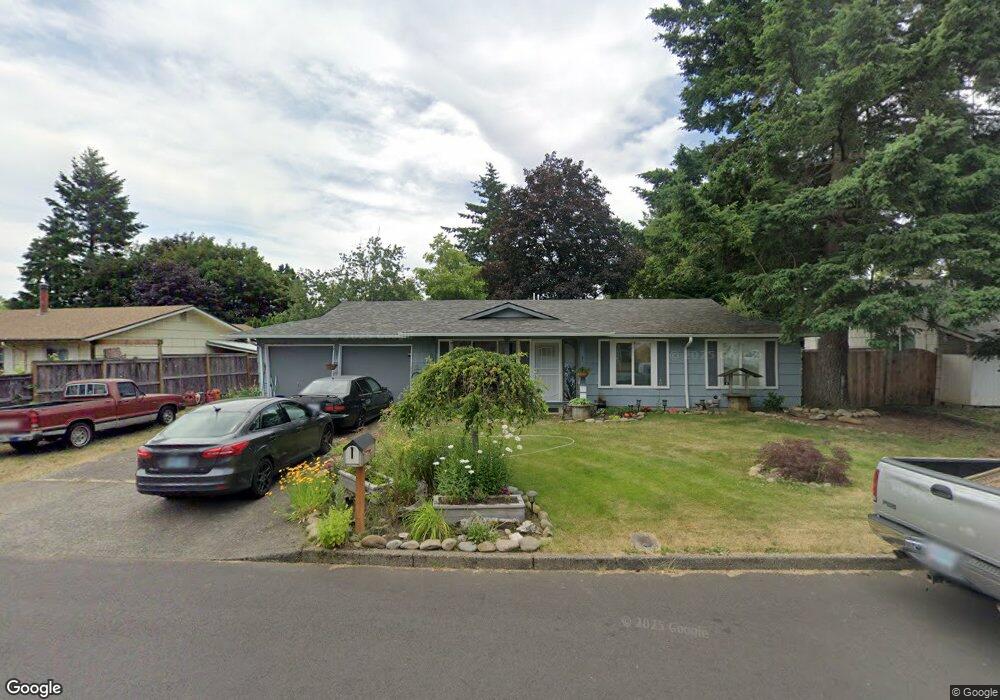
250 NE 23rd St Gresham, OR 97030
North Central NeighborhoodEstimated Value: $396,000 - $413,000
3
Beds
1
Bath
1,280
Sq Ft
$316/Sq Ft
Est. Value
About This Home
This home is located at 250 NE 23rd St, Gresham, OR 97030 and is currently estimated at $403,960, approximately $315 per square foot. 250 NE 23rd St is a home located in Multnomah County with nearby schools including Highland Elementary School, Clear Creek Middle School, and Gresham High School.
Ownership History
Date
Name
Owned For
Owner Type
Purchase Details
Closed on
May 6, 2015
Sold by
Aspen Ho Llc
Bought by
Butler Helen T and Butler Robert P
Current Estimated Value
Home Financials for this Owner
Home Financials are based on the most recent Mortgage that was taken out on this home.
Original Mortgage
$176,739
Outstanding Balance
$135,560
Interest Rate
3.64%
Mortgage Type
FHA
Estimated Equity
$268,400
Purchase Details
Closed on
Sep 18, 2006
Sold by
Butler H Teresa
Bought by
Aspen Ho Llc
Purchase Details
Closed on
May 4, 2005
Sold by
Cedarview Llc
Bought by
Butler H Teresa
Home Financials for this Owner
Home Financials are based on the most recent Mortgage that was taken out on this home.
Original Mortgage
$121,600
Interest Rate
7.1%
Mortgage Type
Purchase Money Mortgage
Purchase Details
Closed on
Jan 28, 2004
Sold by
Frank William B
Bought by
Cedarview Llc
Create a Home Valuation Report for This Property
The Home Valuation Report is an in-depth analysis detailing your home's value as well as a comparison with similar homes in the area
Home Values in the Area
Average Home Value in this Area
Purchase History
| Date | Buyer | Sale Price | Title Company |
|---|---|---|---|
| Butler Helen T | $180,000 | Fidelity National Title | |
| Aspen Ho Llc | $171,315 | Fidelity National Title Co | |
| Butler H Teresa | $152,000 | Fidelity Natl Title Co Of Or | |
| Cedarview Llc | -- | Fidelity Natl Title Co Of Or |
Source: Public Records
Mortgage History
| Date | Status | Borrower | Loan Amount |
|---|---|---|---|
| Open | Butler Helen T | $176,739 | |
| Previous Owner | Butler H Teresa | $121,600 | |
| Closed | Butler H Teresa | $30,400 |
Source: Public Records
Tax History
| Year | Tax Paid | Tax Assessment Tax Assessment Total Assessment is a certain percentage of the fair market value that is determined by local assessors to be the total taxable value of land and additions on the property. | Land | Improvement |
|---|---|---|---|---|
| 2025 | $4,030 | $198,030 | -- | -- |
| 2024 | $3,858 | $192,270 | -- | -- |
| 2023 | $3,515 | $186,670 | $0 | $0 |
| 2022 | $3,416 | $181,240 | $0 | $0 |
| 2021 | $3,330 | $175,970 | $0 | $0 |
| 2020 | $3,134 | $170,850 | $0 | $0 |
| 2019 | $3,052 | $165,880 | $0 | $0 |
| 2018 | $2,910 | $161,050 | $0 | $0 |
| 2017 | $2,792 | $156,360 | $0 | $0 |
| 2016 | $2,461 | $151,810 | $0 | $0 |
Source: Public Records
Map
Nearby Homes
- 450 NE 22nd St
- 535 NE 24th St
- 349 NE 18th St
- 1035 SE 225th Ave
- 1783 1791 NE Beech Place
- 2730 NE Roberts Ave
- 2105 NE Cleveland Ave
- 2775 NE Linden Ave
- 54 NW 13th St
- 1556 NE 27th Terrace
- 660 NE 9th St
- 894 NE Linden Ave
- 21532 SE Alder St
- 920 SE 214th Ave
- 1830 NE Hogan Dr Unit 83
- 1802 NE Hogan Dr Unit 97
- 1795 NE 19th St
- 1722 NE Hogan Dr Unit 103
- 1812 NE 19th St Unit 27
- 1514 NE Hogan Dr Unit 131
- 220 NE 23rd St
- 270 NE 23rd St
- 245 NE 22nd St
- 275 NE 22nd St
- 175 NE 22nd St
- 170 NE 23rd St
- 350 NE 23rd St
- 255 NE 23rd St
- 225 NE 23rd St
- 275 NE 23rd St
- 355 NE 22nd St
- 165 NE 22nd St
- 175 NE 23rd St
- 0 NE Roberts Ave
- 150 NE 23rd St
- 380 NE 23rd St
- 345 NE 23rd St
- 375 NE 22nd St
- 375 NE 23rd St
- 155 NE 23rd St
Your Personal Tour Guide
Ask me questions while you tour the home.