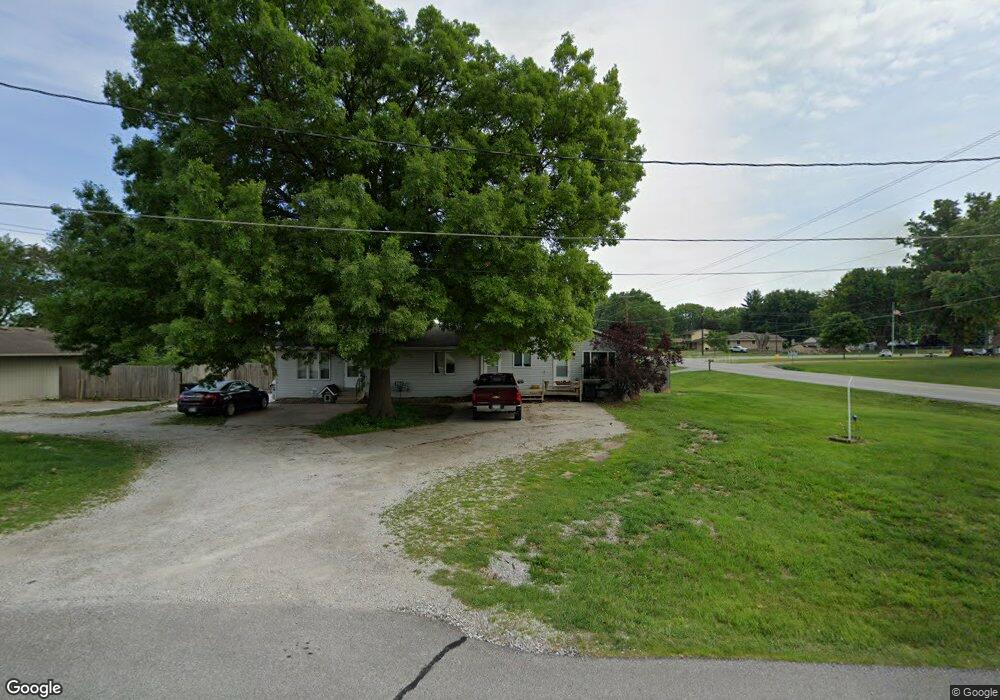
250 NE 57th Place Unit B Des Moines, IA 50313
Marquisville NeighborhoodEstimated Value: $379,459 - $417,000
3
Beds
3
Baths
1,654
Sq Ft
$242/Sq Ft
Est. Value
About This Home
This home is located at 250 NE 57th Place Unit B, Des Moines, IA 50313 and is currently estimated at $400,615, approximately $242 per square foot. 250 NE 57th Place Unit B is a home located in Polk County with nearby schools including Cornell Elementary School, Woodside Middle School, and Saydel High School.
Ownership History
Date
Name
Owned For
Owner Type
Purchase Details
Closed on
Jan 2, 2014
Sold by
Rasmussen Klaus and Rasmussen Peggy
Bought by
Taylor Keith E and Taylor Janey
Current Estimated Value
Home Financials for this Owner
Home Financials are based on the most recent Mortgage that was taken out on this home.
Original Mortgage
$199,150
Outstanding Balance
$149,419
Interest Rate
4.23%
Mortgage Type
VA
Estimated Equity
$251,196
Purchase Details
Closed on
Apr 25, 2000
Sold by
Lauritsen Fred I and Lauritsen Edna
Bought by
Rasmussen Klaus
Home Financials for this Owner
Home Financials are based on the most recent Mortgage that was taken out on this home.
Original Mortgage
$122,700
Interest Rate
8.24%
Purchase Details
Closed on
Oct 1, 1997
Sold by
Lauritsen Fred I
Bought by
Rasmussen Klaus
Create a Home Valuation Report for This Property
The Home Valuation Report is an in-depth analysis detailing your home's value as well as a comparison with similar homes in the area
Home Values in the Area
Average Home Value in this Area
Purchase History
| Date | Buyer | Sale Price | Title Company |
|---|---|---|---|
| Taylor Keith E | $195,000 | None Available | |
| Rasmussen Klaus | $34,500 | -- | |
| Rasmussen Klaus | $35,000 | -- |
Source: Public Records
Mortgage History
| Date | Status | Borrower | Loan Amount |
|---|---|---|---|
| Open | Taylor Keith E | $199,150 | |
| Previous Owner | Rasmussen Klaus | $122,700 |
Source: Public Records
Tax History Compared to Growth
Tax History
| Year | Tax Paid | Tax Assessment Tax Assessment Total Assessment is a certain percentage of the fair market value that is determined by local assessors to be the total taxable value of land and additions on the property. | Land | Improvement |
|---|---|---|---|---|
| 2024 | $4,526 | $349,400 | $52,800 | $296,600 |
| 2023 | $4,408 | $349,400 | $52,800 | $296,600 |
| 2022 | $4,334 | $282,800 | $45,700 | $237,100 |
| 2021 | $4,160 | $282,800 | $45,700 | $237,100 |
| 2020 | $4,100 | $257,300 | $41,100 | $216,200 |
| 2019 | $3,754 | $257,300 | $41,100 | $216,200 |
| 2018 | $3,672 | $227,700 | $35,200 | $192,500 |
| 2017 | $3,270 | $227,700 | $35,200 | $192,500 |
| 2016 | $3,186 | $198,900 | $32,300 | $166,600 |
| 2015 | $3,186 | $198,900 | $32,300 | $166,600 |
| 2014 | $3,138 | $193,800 | $29,500 | $164,300 |
Source: Public Records
Map
Nearby Homes
- 5470 NE 6th St
- 6065 NW 6th Dr
- 940 NE 52nd Ave
- 6447 NE 8th Ct
- 1250 NE 52nd Ave
- 1099 NE 64th Ave
- 1064 NE 64th Ave
- 5170 NE 13th St
- 1335 NE 52nd Ave
- 5175 NE 13th St
- 6417 NE 11th Ct
- 6433 NE 11th Ct
- 6443 NE 11th Ct
- 6570 NE 11th Ct
- 6375 NE 11th Ct
- 6538 NE 11th Ct
- 6546 NE 11th Ct
- 550 NE 48th Place
- 6554 NE 11th Ct
- 580 NE 48th Place
- 250 NE 57th Place
- 5788 NE 3rd St
- 170 NE 57th Place
- 5802 NE 3rd St
- 5702 NE 3rd St
- 130 NE 57th Place
- 225 NE 57th Place
- 129 NE 57th Place
- 50 NE 57th Place
- 5700 NE 3rd St
- 101 NE 57th Place
- 5809 NE 3rd St
- 10 NE 57th Place
- 5705 NE 1st St
- 5695 NE 1st St
- 5821 NE 3rd St
- 15 NW 57th Place
- 5675 NE 1st St
- 5660 NE 3rd St
- 5700 NE 1st St