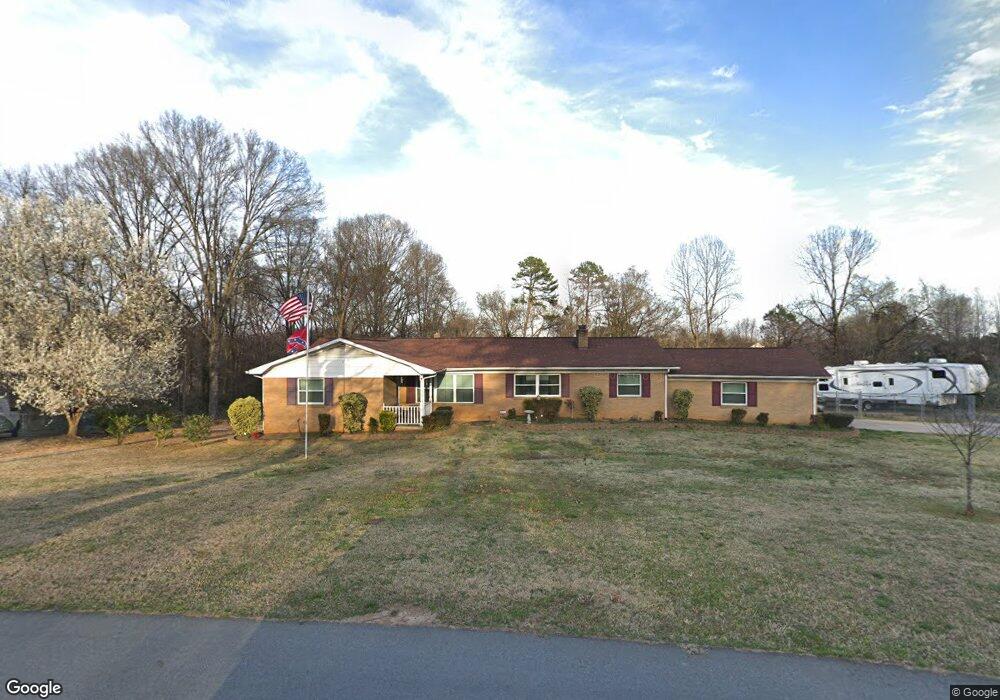
250 Stonewall Cir SW Concord, NC 28027
Estimated Value: $340,000 - $392,000
4
Beds
2
Baths
2,118
Sq Ft
$174/Sq Ft
Est. Value
About This Home
This home is located at 250 Stonewall Cir SW, Concord, NC 28027 and is currently estimated at $368,775, approximately $174 per square foot. 250 Stonewall Cir SW is a home located in Cabarrus County with nearby schools including Wolf Meadow Elementary School, J.N. Fries Middle School, and Branch Christian Academy.
Ownership History
Date
Name
Owned For
Owner Type
Purchase Details
Closed on
Nov 18, 2015
Sold by
Veeder Michael J
Bought by
Veeder Harold B
Current Estimated Value
Purchase Details
Closed on
May 17, 2012
Sold by
Veeder Martina L Mango
Bought by
Veeder Michael J
Purchase Details
Closed on
Sep 9, 2008
Sold by
Hsbc Mortgage Services Inc
Bought by
Veeder Michael J and Veeder Martina L Mango
Purchase Details
Closed on
Jul 18, 2008
Sold by
Bussard Rodney and Bussard Deborah
Bought by
Hsbc Mortgage Services Inc
Purchase Details
Closed on
Aug 15, 2006
Sold by
Lentz Ray B and Lentz Marvie C
Bought by
Bussard Rodney and Bussard Deborah
Home Financials for this Owner
Home Financials are based on the most recent Mortgage that was taken out on this home.
Original Mortgage
$185,000
Interest Rate
9.88%
Mortgage Type
Purchase Money Mortgage
Create a Home Valuation Report for This Property
The Home Valuation Report is an in-depth analysis detailing your home's value as well as a comparison with similar homes in the area
Home Values in the Area
Average Home Value in this Area
Purchase History
| Date | Buyer | Sale Price | Title Company |
|---|---|---|---|
| Veeder Harold B | $89,500 | None Available | |
| Veeder Michael J | -- | None Available | |
| Veeder Michael J | $154,000 | None Available | |
| Hsbc Mortgage Services Inc | $155,265 | None Available | |
| Bussard Rodney | $185,000 | None Available |
Source: Public Records
Mortgage History
| Date | Status | Borrower | Loan Amount |
|---|---|---|---|
| Previous Owner | Bussard Rodney | $185,000 |
Source: Public Records
Tax History Compared to Growth
Tax History
| Year | Tax Paid | Tax Assessment Tax Assessment Total Assessment is a certain percentage of the fair market value that is determined by local assessors to be the total taxable value of land and additions on the property. | Land | Improvement |
|---|---|---|---|---|
| 2025 | -- | $311,790 | $80,000 | $231,790 |
| 2024 | $3,105 | $311,790 | $80,000 | $231,790 |
| 2023 | $2,635 | $215,990 | $48,000 | $167,990 |
| 2022 | $2,635 | $215,990 | $48,000 | $167,990 |
| 2021 | $2,635 | $215,990 | $48,000 | $167,990 |
| 2020 | $2,635 | $215,990 | $48,000 | $167,990 |
| 2019 | $2,329 | $190,920 | $35,200 | $155,720 |
| 2018 | $2,291 | $190,920 | $35,200 | $155,720 |
| 2017 | $2,253 | $190,920 | $35,200 | $155,720 |
| 2016 | $1,336 | $182,850 | $35,200 | $147,650 |
| 2015 | $1,944 | $182,850 | $35,200 | $147,650 |
| 2014 | $1,944 | $182,850 | $35,200 | $147,650 |
Source: Public Records
Map
Nearby Homes
- 609 Faith Dr SW Unit 1
- 2824 Trestle Ct SW
- 2893 Signal Ct SW
- Lot #2 Faith Dr SW
- 1255 Old Charlotte Rd
- 1067 Old Charlotte Rd
- 518 Viking Place SW
- 809 Fargo Dr SW
- 84 Highland Ave SW
- 82 Highland Ave SW
- 493 Debra Cir SW
- 3168 Sossamon Place
- 664 Jackson Terrace SW
- 668 Jackson Terrace SW
- 782 Chalice St SW
- 3073 Champion Ln SW
- 758 Main St SW
- 933 Old Charlotte Rd
- 207 Highland Ave SW
- 64 Robinson Dr SW
- 258 Stonewall Cir SW
- 255 Stonewall Cir SW
- 3829 Trestle Ct SW
- 660 Faith Dr SW
- 241 Stonewall Cir SW
- 241 Stonewall Cir SW
- 658 Faith Dr SW
- 668 Faith Dr SW
- 672 Faith Dr SW
- 670 Faith Dr SW
- 262 Stonewall Cir SW
- 2899 Rockingham Ct SW
- 265 Stonewall Cir SW
- 2891 Rockingham Ct SW
- 2907 Rockingham Ct SW
- 675 Faith Dr SW
- 2911 Rockingham Ct SW
- 677 Faith Dr SW
- 233 Stonewall Cir SW
- 673 Faith Dr SW