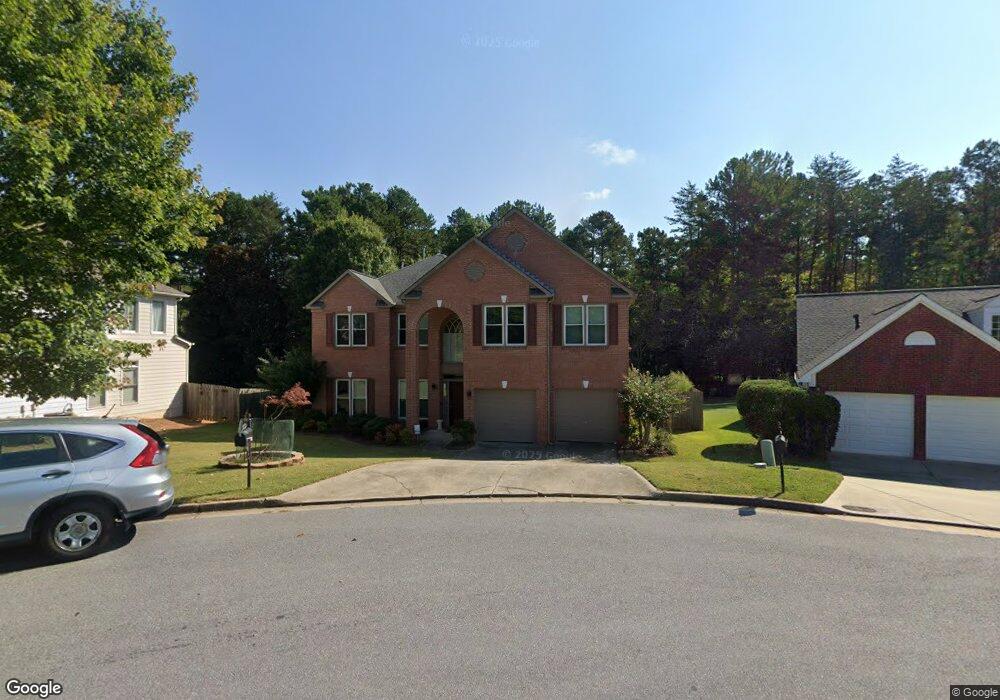
250 Treadstone Overlook Unit 2 Suwanee, GA 30024
Estimated Value: $676,000 - $750,000
4
Beds
3
Baths
3,248
Sq Ft
$219/Sq Ft
Est. Value
About This Home
This home is located at 250 Treadstone Overlook Unit 2, Suwanee, GA 30024 and is currently estimated at $710,459, approximately $218 per square foot. 250 Treadstone Overlook Unit 2 is a home located in Fulton County with nearby schools including Shakerag Elementary School, River Trail Middle School, and Northview High School.
Ownership History
Date
Name
Owned For
Owner Type
Purchase Details
Closed on
Jul 10, 2023
Sold by
Lim Alvin
Bought by
Lim Arthur and Lim Maria Estela
Current Estimated Value
Purchase Details
Closed on
May 12, 2006
Sold by
Kim Dong H and Kim Shin Y
Bought by
Lim Alvin and Delosreyes Marie
Home Financials for this Owner
Home Financials are based on the most recent Mortgage that was taken out on this home.
Original Mortgage
$268,000
Interest Rate
6.41%
Mortgage Type
New Conventional
Purchase Details
Closed on
Sep 30, 1998
Sold by
The Ryland Group Inc
Bought by
Kim Dong Hwan and Shin Young
Home Financials for this Owner
Home Financials are based on the most recent Mortgage that was taken out on this home.
Original Mortgage
$205,209
Interest Rate
6.8%
Mortgage Type
New Conventional
Create a Home Valuation Report for This Property
The Home Valuation Report is an in-depth analysis detailing your home's value as well as a comparison with similar homes in the area
Home Values in the Area
Average Home Value in this Area
Purchase History
| Date | Buyer | Sale Price | Title Company |
|---|---|---|---|
| Lim Arthur | $585,000 | -- | |
| Lim Alvin | $335,000 | -- | |
| Kim Dong Hwan | $228,100 | -- |
Source: Public Records
Mortgage History
| Date | Status | Borrower | Loan Amount |
|---|---|---|---|
| Previous Owner | Lim Alvin | $268,000 | |
| Previous Owner | Kim Dong Hwan | $205,209 |
Source: Public Records
Tax History Compared to Growth
Tax History
| Year | Tax Paid | Tax Assessment Tax Assessment Total Assessment is a certain percentage of the fair market value that is determined by local assessors to be the total taxable value of land and additions on the property. | Land | Improvement |
|---|---|---|---|---|
| 2025 | $6,765 | $237,200 | $48,600 | $188,600 |
| 2023 | $6,695 | $237,200 | $48,600 | $188,600 |
| 2022 | $3,793 | $195,080 | $33,400 | $161,680 |
| 2021 | $3,745 | $152,960 | $25,240 | $127,720 |
| 2020 | $3,764 | $137,680 | $24,720 | $112,960 |
| 2019 | $444 | $137,680 | $24,720 | $112,960 |
| 2018 | $3,412 | $137,680 | $24,720 | $112,960 |
| 2017 | $3,664 | $119,800 | $19,320 | $100,480 |
| 2016 | $3,603 | $119,800 | $19,320 | $100,480 |
| 2015 | $3,642 | $119,800 | $19,320 | $100,480 |
| 2014 | $3,765 | $119,800 | $19,320 | $100,480 |
Source: Public Records
Map
Nearby Homes
- 4141 Riverview Run Ct
- 10950 Regal Forest Dr
- 4140 River Bluff Run Way Unit 5B
- 1355 Chattahoochee Run Dr
- 1900 Chattahoochee Run Dr
- 4055 Vista Point Ln
- 764 Morganton Dr
- 1581 Shetland Pony Ct
- 1581 Shetland Pony Ct NW
- 1145 River Laurel Dr Unit 3
- 4148 Little Hannah Dr
- 1547 Welch Ct
- 1105 River Laurel Dr
- 4138 Little Hannah Dr
- 3987 Riversong Ct
- 4009 Riverstone Dr
- 1032 Laurel Grove Ct
- 4119 Little Hannah Dr
- 4270 Laurel Grove Trace
- 1029 Laurel Grove Ct
- 240 Treadstone Overlook
- 260 Treadstone Overlook Unit 2
- 230 Treadstone Overlook Unit 2
- 225 Treadstone Overlook
- 265 Treadstone Overlook Unit 2
- 255 Treadstone Overlook Unit 2
- 215 Treadstone Overlook
- 220 Treadstone Overlook Unit 2
- 235 Treadstone Overlook Unit 2
- 210 Treadstone
- 210 Treadstone Overlook
- 245 Treadstone Overlook
- 195 Treadstone Overlook
- 205 Treadstone Overlook
- 200 Treadstone Overlook Unit 2
- 780 Treadstone Ct
- 780 Treadstone Ct Unit 780
- 760 Treadstone Ct
- 770 Treadstone Ct Unit 2
- 750 Treadstone Ct Unit 2