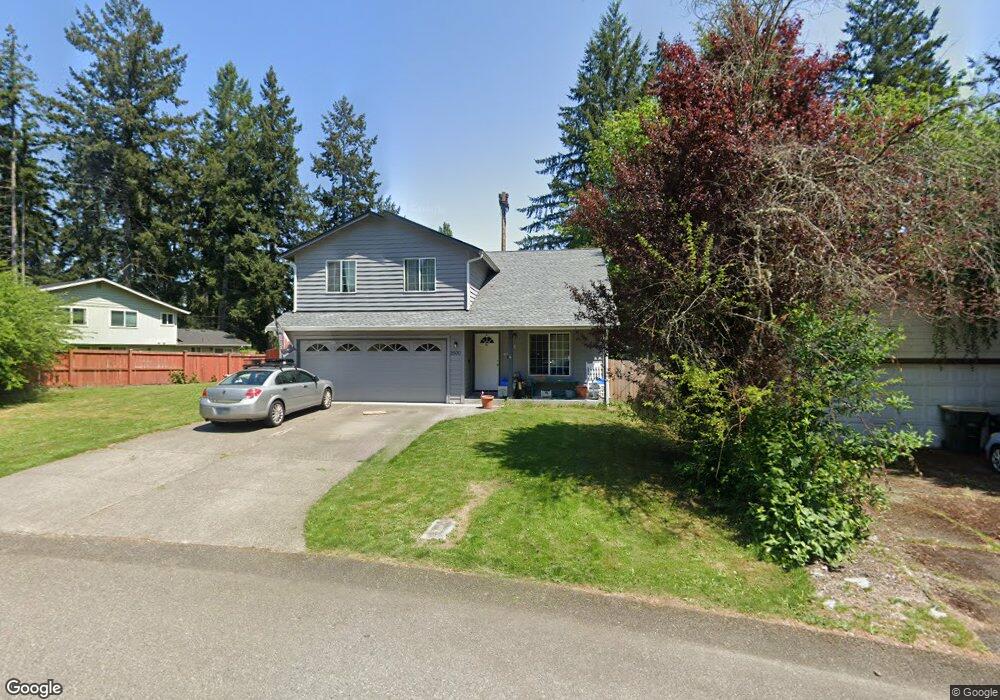
2500 25th Ct SE Lacey, WA 98503
Central Lacey NeighborhoodEstimated Value: $473,000 - $514,000
4
Beds
2
Baths
1,580
Sq Ft
$310/Sq Ft
Est. Value
About This Home
This home is located at 2500 25th Ct SE, Lacey, WA 98503 and is currently estimated at $490,582, approximately $310 per square foot. 2500 25th Ct SE is a home located in Thurston County with nearby schools including Mountain View Elementary School, Komachin Middle School, and Timberline High School.
Ownership History
Date
Name
Owned For
Owner Type
Purchase Details
Closed on
Oct 19, 2007
Sold by
Quaade Tony L and Quaade Glenda K
Bought by
Quaade Jong Ja
Current Estimated Value
Purchase Details
Closed on
Jul 7, 2006
Sold by
Quaade Jong Ja and Quaade Tony L
Bought by
Three Q Investments Llc
Purchase Details
Closed on
Mar 22, 2006
Sold by
Groeser Joseph F and Groeser Rebecca L
Bought by
Quaade Jong Ja and Quaade Tony L
Purchase Details
Closed on
Jul 16, 1998
Sold by
Hoel Construction Company Inc
Bought by
Groeser Joseph F and Groeser Rebecca L
Home Financials for this Owner
Home Financials are based on the most recent Mortgage that was taken out on this home.
Original Mortgage
$128,006
Interest Rate
7%
Mortgage Type
FHA
Purchase Details
Closed on
Apr 9, 1997
Sold by
Tehseldar Samir M and Tehseldar Lisa I
Bought by
Hoel Construction Company Inc
Create a Home Valuation Report for This Property
The Home Valuation Report is an in-depth analysis detailing your home's value as well as a comparison with similar homes in the area
Home Values in the Area
Average Home Value in this Area
Purchase History
| Date | Buyer | Sale Price | Title Company |
|---|---|---|---|
| Quaade Jong Ja | -- | None Available | |
| Three Q Investments Llc | -- | None Available | |
| Quaade Jong Ja | $229,900 | Stewart Title Of Western | |
| Groeser Joseph F | $129,951 | First American Title Ins Co | |
| Hoel Construction Company Inc | -- | First American Title Ins Co |
Source: Public Records
Mortgage History
| Date | Status | Borrower | Loan Amount |
|---|---|---|---|
| Previous Owner | Groeser Joseph F | $128,006 |
Source: Public Records
Tax History Compared to Growth
Tax History
| Year | Tax Paid | Tax Assessment Tax Assessment Total Assessment is a certain percentage of the fair market value that is determined by local assessors to be the total taxable value of land and additions on the property. | Land | Improvement |
|---|---|---|---|---|
| 2024 | $4,019 | $433,300 | $140,900 | $292,400 |
| 2023 | $4,019 | $420,200 | $125,200 | $295,000 |
| 2022 | $3,853 | $403,800 | $85,500 | $318,300 |
| 2021 | $3,422 | $331,100 | $92,900 | $238,200 |
| 2020 | $2,993 | $273,900 | $89,800 | $184,100 |
| 2019 | $2,700 | $248,800 | $74,600 | $174,200 |
| 2018 | $2,952 | $219,800 | $50,500 | $169,300 |
| 2017 | $2,677 | $209,950 | $48,650 | $161,300 |
| 2016 | $2,579 | $198,450 | $54,150 | $144,300 |
| 2014 | -- | $197,250 | $54,150 | $143,100 |
Source: Public Records
Map
Nearby Homes
- 5412 Melody Dr SE
- 2510 Greenlawn St SE
- 2402 Brentwood Dr SE
- 5605 22nd Ave SE
- 5102 23rd Ave SE
- 5612 29th Ct SE
- 2598 25th Loop SE
- 5005 23rd Ave SE
- 5004 Brentwood Dr SE
- 4911 20th Ave SE
- 1614 Gemini St SE
- 4709 26th Ave SE
- 5001 18th Ave SE
- 1503 Dogwood St SE
- 5015 15th Ave SE
- 1409 Alder St SE
- 2617 College St SE
- 4715 31st Ave SE
- 51 XX 14th Ave SE
- 4513 22nd Ave SE
- 2504 25th Ct SE
- 2506 25th Ct SE
- 2414 Detlefsen Place SE
- 5319 25th Ave SE
- 2413 Detlefsen Place SE
- 2512 25th Loop SE
- 2512 25th Ct SE
- 2410 Detlefsen Place SE
- 2409 Sycamore St SE
- 5313 25th Ave SE
- 2409 Detlefsen Place SE
- 2405 Sycamore St SE
- 2518 25th Ct SE
- 2401 Sycamore St SE
- 5307 25th Ave SE
- 2405 Detlefsen Place SE
- 2406 Detlefsen Place SE
- 2524 25th Ct SE
- 2313 Sycamore St SE
- 2473 Ruddell Rd SE