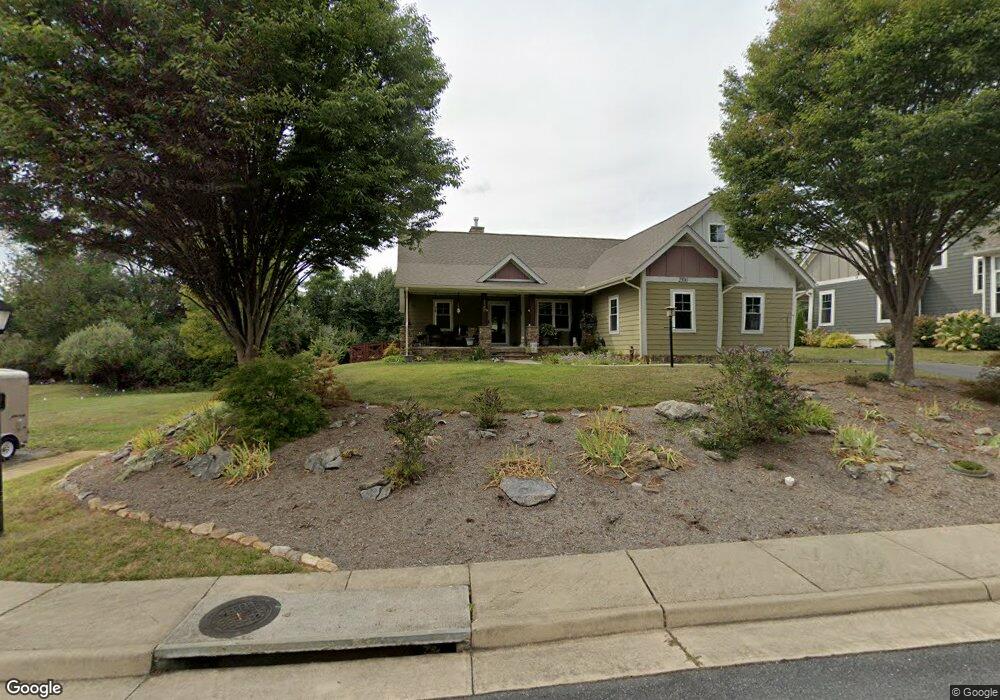
2500 Belvue Rd Waynesboro, VA 22980
Estimated Value: $463,181 - $533,000
3
Beds
2
Baths
1,836
Sq Ft
$276/Sq Ft
Est. Value
About This Home
This home is located at 2500 Belvue Rd, Waynesboro, VA 22980 and is currently estimated at $506,795, approximately $276 per square foot. 2500 Belvue Rd is a home located in Waynesboro City with nearby schools including Westwood Hills Elementary School, Kate Collins Middle School, and Waynesboro High School.
Ownership History
Date
Name
Owned For
Owner Type
Purchase Details
Closed on
Jun 29, 2017
Sold by
Fallfax Inc A Virginia Corporation Succe
Bought by
Keller D Kathleen
Current Estimated Value
Purchase Details
Closed on
Jul 20, 2015
Sold by
Capler Development Llc
Bought by
Keller D Kathleen
Home Financials for this Owner
Home Financials are based on the most recent Mortgage that was taken out on this home.
Original Mortgage
$248,000
Interest Rate
3.88%
Mortgage Type
New Conventional
Purchase Details
Closed on
Oct 14, 2014
Sold by
Fallfax Inc
Bought by
Capler Development Llc
Home Financials for this Owner
Home Financials are based on the most recent Mortgage that was taken out on this home.
Original Mortgage
$232,500
Interest Rate
4.1%
Create a Home Valuation Report for This Property
The Home Valuation Report is an in-depth analysis detailing your home's value as well as a comparison with similar homes in the area
Home Values in the Area
Average Home Value in this Area
Purchase History
| Date | Buyer | Sale Price | Title Company |
|---|---|---|---|
| Keller D Kathleen | -- | None Available | |
| Keller D Kathleen | $310,000 | -- | |
| Capler Development Llc | $42,500 | -- |
Source: Public Records
Mortgage History
| Date | Status | Borrower | Loan Amount |
|---|---|---|---|
| Previous Owner | Capler Development Llc | $248,000 | |
| Previous Owner | Capler Development Llc | $232,500 |
Source: Public Records
Tax History Compared to Growth
Tax History
| Year | Tax Paid | Tax Assessment Tax Assessment Total Assessment is a certain percentage of the fair market value that is determined by local assessors to be the total taxable value of land and additions on the property. | Land | Improvement |
|---|---|---|---|---|
| 2025 | $3,724 | $454,100 | $75,000 | $379,100 |
| 2024 | $3,189 | $414,200 | $65,000 | $349,200 |
| 2023 | $3,189 | $414,200 | $65,000 | $349,200 |
| 2022 | $2,909 | $323,200 | $60,000 | $263,200 |
| 2021 | $2,909 | $323,200 | $60,000 | $263,200 |
| 2020 | $2,645 | $293,900 | $60,000 | $233,900 |
| 2019 | $2,645 | $293,900 | $60,000 | $233,900 |
| 2018 | $2,254 | $250,400 | $60,000 | $190,400 |
| 2017 | $2,178 | $250,400 | $60,000 | $190,400 |
| 2016 | $1,963 | $245,400 | $60,000 | $185,400 |
| 2015 | $412 | $245,400 | $60,000 | $185,400 |
| 2014 | -- | $52,500 | $52,500 | $0 |
| 2013 | -- | $0 | $0 | $0 |
Source: Public Records
Map
Nearby Homes
- 2509 Belvue Rd Unit 18
- 2509 Belvue Rd
- 2524 Belvue Rd
- 2500 Forest Dr
- 2418 Mount Vernon St
- PENWELL Plan at Kira Heights
- SALEM Plan at Kira Heights
- NEUVILLE Plan at Kira Heights
- 2224 Mount Vernon St
- 208 Sunbird Ln
- 1229 Rosser Ave
- 62B Springdale Rd
- 62A Springdale Rd
- 140 Springdale Rd
- 65 Springdale Rd
- 213 Sunbird Ln
- 144 Sunbird Ln
- 145 Sunbird Ln
- 131 Springdale Rd
- 2508 Belvue Rd
- 2440 Belvue Rd
- 2516 Belvue Rd
- 2509 Belvue Rd Unit 17
- 2517 Belvue Rd 19 Unit 19
- 2517 Forest Dr
- 2509 Forest Dr Unit 17
- 2509 Forest Dr
- 2433 Belvue Rd
- 2517 Belvue Rd Unit 19
- 2517 Belvue Rd
- 2432 Belvue Rd
- 2524 Belvue Rd Unit 27
- 2509 Forest Dr 17 Unit 17
- 2525 Belvue Rd Unit 20
- 2525 Belvue Rd
- 2532 Belvue Rd
- 2425 Belvue Rd
- 1008 High Point Ct Unit 15
- 1008 High Point Ct