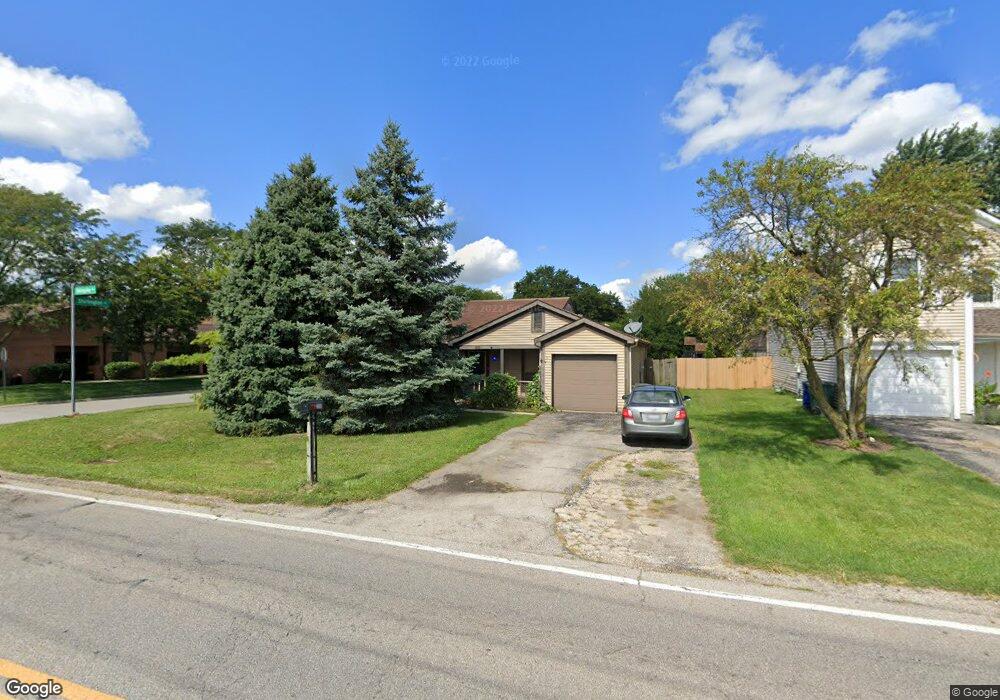
2500 Billingsley Rd Columbus, OH 43235
Foxboro NeighborhoodEstimated Value: $274,000 - $306,000
3
Beds
1
Bath
1,220
Sq Ft
$235/Sq Ft
Est. Value
About This Home
This home is located at 2500 Billingsley Rd, Columbus, OH 43235 and is currently estimated at $286,325, approximately $234 per square foot. 2500 Billingsley Rd is a home located in Franklin County with nearby schools including Albert Chapman Elementary School, Ann Simpson Davis Middle School, and Dublin Scioto High School.
Ownership History
Date
Name
Owned For
Owner Type
Purchase Details
Closed on
Feb 1, 2008
Sold by
Accredited Home Lenders Inc
Bought by
Edwards Investment Group Llc
Current Estimated Value
Home Financials for this Owner
Home Financials are based on the most recent Mortgage that was taken out on this home.
Original Mortgage
$104,000
Outstanding Balance
$64,529
Interest Rate
5.75%
Mortgage Type
Purchase Money Mortgage
Estimated Equity
$221,796
Purchase Details
Closed on
Dec 5, 2007
Sold by
Abarghaz Sungye and Mortgage Electronic Registrati
Bought by
Accredited Home Lenders Inc
Home Financials for this Owner
Home Financials are based on the most recent Mortgage that was taken out on this home.
Original Mortgage
$104,000
Outstanding Balance
$64,529
Interest Rate
5.75%
Mortgage Type
Purchase Money Mortgage
Estimated Equity
$221,796
Purchase Details
Closed on
Feb 15, 1994
Purchase Details
Closed on
Jun 1, 1984
Create a Home Valuation Report for This Property
The Home Valuation Report is an in-depth analysis detailing your home's value as well as a comparison with similar homes in the area
Home Values in the Area
Average Home Value in this Area
Purchase History
| Date | Buyer | Sale Price | Title Company |
|---|---|---|---|
| Edwards Investment Group Llc | $90,000 | Titlequest | |
| Accredited Home Lenders Inc | $90,000 | None Available | |
| -- | $66,900 | -- | |
| -- | $56,200 | -- |
Source: Public Records
Mortgage History
| Date | Status | Borrower | Loan Amount |
|---|---|---|---|
| Open | Edwards Investment Group Llc | $104,000 |
Source: Public Records
Tax History Compared to Growth
Tax History
| Year | Tax Paid | Tax Assessment Tax Assessment Total Assessment is a certain percentage of the fair market value that is determined by local assessors to be the total taxable value of land and additions on the property. | Land | Improvement |
|---|---|---|---|---|
| 2024 | $4,800 | $77,740 | $34,550 | $43,190 |
| 2023 | $4,733 | $77,735 | $34,545 | $43,190 |
| 2022 | $3,586 | $54,570 | $20,230 | $34,340 |
| 2021 | $3,644 | $54,570 | $20,230 | $34,340 |
| 2020 | $3,623 | $54,570 | $20,230 | $34,340 |
| 2019 | $3,342 | $44,560 | $16,870 | $27,690 |
| 2018 | $3,319 | $44,560 | $16,870 | $27,690 |
| 2017 | $3,178 | $44,560 | $16,870 | $27,690 |
| 2016 | $3,260 | $44,040 | $13,830 | $30,210 |
| 2015 | $3,280 | $44,040 | $13,830 | $30,210 |
| 2014 | $3,283 | $44,040 | $13,830 | $30,210 |
| 2013 | $1,667 | $44,030 | $13,825 | $30,205 |
Source: Public Records
Map
Nearby Homes
- 2462 Sanford Dr
- 2456 Sanford Dr
- 2469 Sandstrom Dr
- 2392 Dunsworth Dr
- 2488 Dunstan Dr
- 7871 Thornfield Ln
- 7917 Meadowhaven Blvd Unit 11
- 2220 Surreygate Dr
- 2423 Sutter Pkwy
- 2620 Cedar Lake Dr Unit 2620
- 7373 Palmleaf Ln
- 7385 Cimmaron Station
- 3915 Inverness Cir Unit 3915
- 2161 Heatherfield Ave
- 2074 Hard Rd
- 2001 Sawbury Blvd Unit 2001
- 2475 Slateshire Dr
- 1996 Starbridge Ct
- 1930 Shallowford Ave
- 6921 Spruce Pine Dr
- 2494 Billingsley Rd
- 2488 Billingsley Rd
- 2501 Dunsworth Dr
- 2493 Dunsworth Dr
- 2482 Billingsley Rd
- 2487 Dunsworth Dr
- 2481 Dunsworth Dr
- 2476 Billingsley Rd
- 2475 Dunsworth Dr
- 2470 Billingsley Rd
- 2469 Dunsworth Dr
- 2502 Dunsworth Dr
- 2535 Annelane Blvd
- 2496 Dunsworth Dr
- 2464 Billingsley Rd
- 2488 Dunsworth Dr
- 2463 Dunsworth Dr
- 2482 Dunsworth Dr
- 2458 Billingsley Rd
- 2547 Annelane Blvd Unit AD