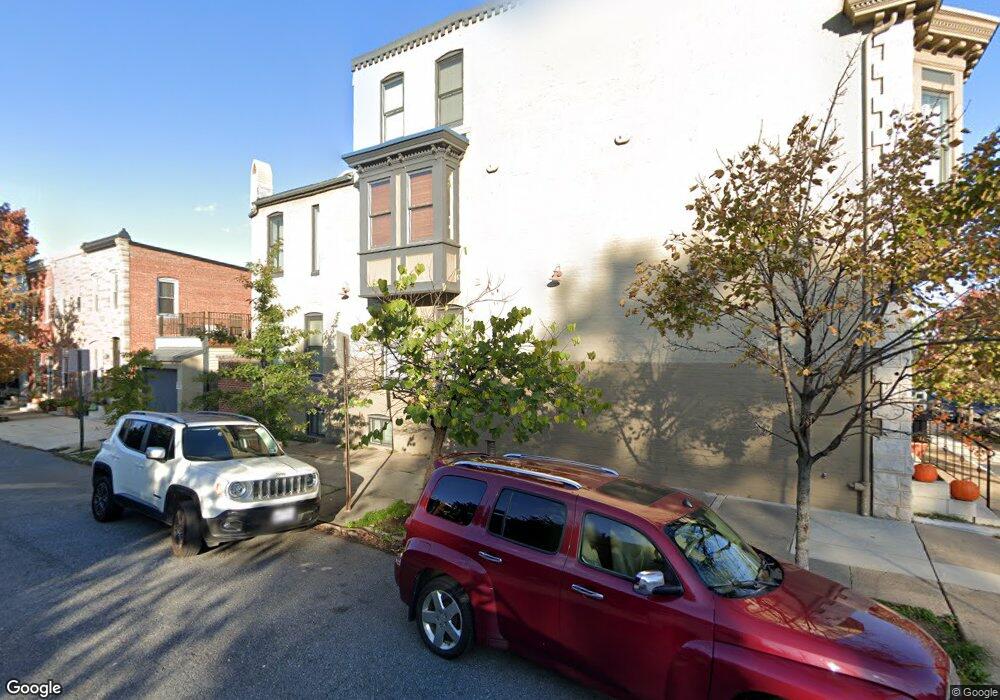
2500 E Baltimore St Baltimore, MD 21224
Patterson Park NeighborhoodEstimated Value: $361,000
5
Beds
2
Baths
2,220
Sq Ft
$163/Sq Ft
Est. Value
About This Home
This home is located at 2500 E Baltimore St, Baltimore, MD 21224 and is currently estimated at $361,000, approximately $162 per square foot. 2500 E Baltimore St is a home located in Baltimore City with nearby schools including William Paca Elementary School, Booker T. Washington Middle School, and Paul Laurence Dunbar High School.
Ownership History
Date
Name
Owned For
Owner Type
Purchase Details
Closed on
Jun 7, 2024
Sold by
Klein Lindsay and Crummey Andrew
Bought by
Crummey Andrew
Current Estimated Value
Purchase Details
Closed on
Mar 24, 2011
Sold by
Fish Michael
Bought by
Crummey Andrew and Klein Lindsay
Home Financials for this Owner
Home Financials are based on the most recent Mortgage that was taken out on this home.
Original Mortgage
$125,000
Interest Rate
10%
Mortgage Type
Purchase Money Mortgage
Purchase Details
Closed on
Dec 28, 2010
Sold by
Jmg Financial Group Llc
Bought by
Fish Michael
Purchase Details
Closed on
Dec 9, 1996
Sold by
B & B Residential
Bought by
Jones Melvin L and Jones Dorothy L
Purchase Details
Closed on
Sep 12, 1996
Sold by
Mavrellos Stamatis
Bought by
B & B Residential and Management, Llc
Create a Home Valuation Report for This Property
The Home Valuation Report is an in-depth analysis detailing your home's value as well as a comparison with similar homes in the area
Home Values in the Area
Average Home Value in this Area
Purchase History
| Date | Buyer | Sale Price | Title Company |
|---|---|---|---|
| Crummey Andrew | -- | None Listed On Document | |
| Crummey Andrew | $165,000 | Dulaney Title & Escrow Llc | |
| Fish Michael | $120,000 | -- | |
| Jones Melvin L | $120,000 | -- | |
| B & B Residential | $41,500 | -- |
Source: Public Records
Mortgage History
| Date | Status | Borrower | Loan Amount |
|---|---|---|---|
| Previous Owner | Crummey Andrew | $125,000 | |
| Previous Owner | Crummey Andrew | $23,500 |
Source: Public Records
Tax History
| Year | Tax Paid | Tax Assessment Tax Assessment Total Assessment is a certain percentage of the fair market value that is determined by local assessors to be the total taxable value of land and additions on the property. | Land | Improvement |
|---|---|---|---|---|
| 2025 | $8,204 | $349,300 | $50,000 | $299,300 |
| 2024 | $8,204 | $349,300 | $50,000 | $299,300 |
| 2023 | $9,626 | $407,900 | $0 | $0 |
| 2022 | $9,067 | $384,200 | $50,000 | $334,200 |
| 2021 | $8,705 | $368,867 | $0 | $0 |
| 2020 | $4,747 | $353,533 | $0 | $0 |
| 2019 | $4,365 | $338,200 | $50,000 | $288,200 |
| 2018 | $4,385 | $338,200 | $50,000 | $288,200 |
| 2017 | $4,385 | $338,200 | $0 | $0 |
| 2016 | $5,836 | $347,300 | $0 | $0 |
| 2015 | $5,836 | $339,867 | $0 | $0 |
| 2014 | $5,836 | $332,433 | $0 | $0 |
Source: Public Records
Map
Nearby Homes
- 2328 E Baltimore St
- 116 N Milton Ave
- 2519 E Fairmount Ave
- 2307 E Fairmount Ave
- 130 N Montford Ave
- 104 N Patterson Park Ave
- 2206 E Baltimore St
- 2317 E Fayette St
- 120 N Glover St
- 202 N Port St
- 204 N Port St
- 106 N Madeira St
- 127 N Glover St
- 217 N Port St
- 2208 E Lombard St
- 219 N Montford Ave
- 224 N Port St
- 220 N Montford Ave
- 2123 E Fairmount Ave
- 220 N Luzerne Ave
- 2502 E Baltimore St
- 2504 E Baltimore St
- 2506 E Baltimore St
- 2508 E Baltimore St
- 1 N Milton Ave
- 2456 E Baltimore St
- 2510 E Baltimore St
- 3 N Milton Ave
- 2436 E Baltimore St
- 2512 E Baltimore St
- 5 N Milton Ave
- 2434 E Baltimore St
- 7 N Milton Ave
- 2514 E Baltimore St
- 9 N Milton Ave
- 2432 E Baltimore St
- 2516 E Baltimore St
- 11 N Milton Ave
- 2 N Milton Ave
- 2 N Rose St
Your Personal Tour Guide
Ask me questions while you tour the home.