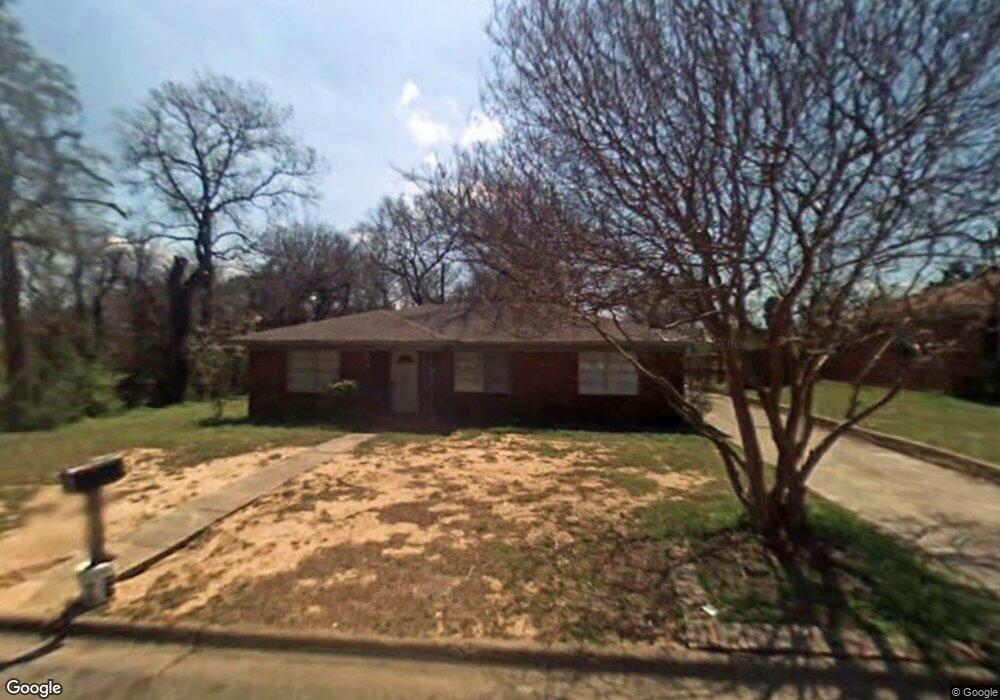
2500 Lockloma St Denison, TX 75020
Estimated Value: $246,512 - $289,000
3
Beds
2
Baths
1,463
Sq Ft
$183/Sq Ft
Est. Value
About This Home
This home is located at 2500 Lockloma St, Denison, TX 75020 and is currently estimated at $267,756, approximately $183 per square foot. 2500 Lockloma St is a home located in Grayson County with nearby schools including Mayes Elementary School, Scott Middle School, and Denison High School.
Ownership History
Date
Name
Owned For
Owner Type
Purchase Details
Closed on
Aug 25, 2022
Sold by
Glenn Fenner Charles
Bought by
Mary And Charles Fenner Revocable Trust
Current Estimated Value
Purchase Details
Closed on
Aug 29, 2019
Sold by
Herrin Jay L and Herrin Lisa
Bought by
Fenner Charles Glenn and Fenner Mary Kathy
Home Financials for this Owner
Home Financials are based on the most recent Mortgage that was taken out on this home.
Original Mortgage
$132,000
Interest Rate
3.8%
Mortgage Type
New Conventional
Purchase Details
Closed on
May 15, 2018
Sold by
Hinsley Michael and Hinsley Rachel
Bought by
Herrin Jay and Herrin Lisa
Home Financials for this Owner
Home Financials are based on the most recent Mortgage that was taken out on this home.
Original Mortgage
$136,000
Interest Rate
4.44%
Mortgage Type
New Conventional
Purchase Details
Closed on
Dec 13, 2004
Sold by
Polston William Preston
Bought by
Herrin Jay L
Create a Home Valuation Report for This Property
The Home Valuation Report is an in-depth analysis detailing your home's value as well as a comparison with similar homes in the area
Home Values in the Area
Average Home Value in this Area
Purchase History
| Date | Buyer | Sale Price | Title Company |
|---|---|---|---|
| Mary And Charles Fenner Revocable Trust | -- | None Listed On Document | |
| Fenner Charles Glenn | -- | Red River Title Co | |
| Herrin Jay | -- | None Available | |
| Herrin Jay L | -- | -- |
Source: Public Records
Mortgage History
| Date | Status | Borrower | Loan Amount |
|---|---|---|---|
| Previous Owner | Fenner Charles Glenn | $132,000 | |
| Previous Owner | Herrin Jay | $136,000 |
Source: Public Records
Tax History
| Year | Tax Paid | Tax Assessment Tax Assessment Total Assessment is a certain percentage of the fair market value that is determined by local assessors to be the total taxable value of land and additions on the property. | Land | Improvement |
|---|---|---|---|---|
| 2025 | $876 | $169,303 | -- | -- |
| 2024 | $3,576 | $153,912 | $0 | $0 |
| 2023 | $876 | $139,920 | $0 | $0 |
| 2022 | $3,022 | $127,200 | $0 | $0 |
| 2021 | $2,916 | $186,014 | $31,626 | $154,388 |
| 2020 | $4,588 | $173,953 | $17,728 | $156,225 |
| 2019 | $2,630 | $162,728 | $17,728 | $145,000 |
| 2018 | $2,410 | $143,565 | $14,699 | $128,866 |
| 2017 | $2,210 | $133,401 | $12,918 | $120,483 |
| 2016 | $2,009 | $105,671 | $12,650 | $93,021 |
Source: Public Records
Map
Nearby Homes
- 509 Bryan Dr
- 2603 Brookhaven Dr
- 2408 Miller St
- 2508 W Crawford St
- 218 Jenny Ln
- 201 Ross Ave
- 2385 Miller St
- 713 Briarwood Dr
- Flora ,TBD Flora Ln
- 2500 Brookhaven Dr
- 22 Haven Cir
- TBD W Crawford St
- 104 N Imperial Dr
- 110 S Hickory Ave
- 112 N Imperial Dr
- 2331 Brookhaven Dr
- 2105 W Crawford St
- 124 N Imperial Dr
- 901 Waterloo Lake Dr
- 813 Glen Key St
- 2510 Lockloma St
- 2520 Lockloma St
- 2501 Lockloma St
- 2511 Lockloma St
- 330 Holland Dr
- 2530 Lockloma St
- 2521 Lockloma St
- 515 Marcel Lockloma Ct
- 400 Holland Dr
- 2500 Holiday St
- 507 Marcel & 506-08
- 402 Holland Dr
- 2531 Lockloma St
- 2600 Lockloma St
- 2601 W Crawford St
- 2526 Holiday St
- 406 Holland Dr
- 519 Marcel Dr
- 527 Marcel Dr
- 329 Holland Dr
Your Personal Tour Guide
Ask me questions while you tour the home.