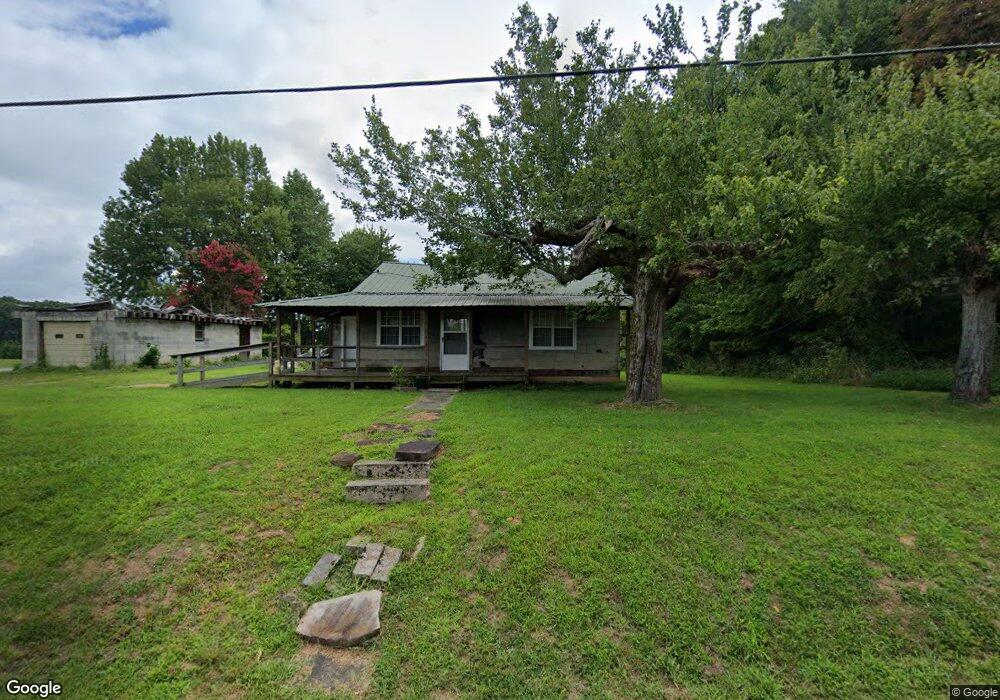
2500 Old Bon Air Rd Sparta, TN 38583
Estimated Value: $303,000 - $325,318
--
Bed
2
Baths
940
Sq Ft
$334/Sq Ft
Est. Value
About This Home
This home is located at 2500 Old Bon Air Rd, Sparta, TN 38583 and is currently estimated at $314,159, approximately $334 per square foot. 2500 Old Bon Air Rd is a home located in White County with nearby schools including Bon De Croft Elementary School, White County Middle School, and White County High School.
Ownership History
Date
Name
Owned For
Owner Type
Purchase Details
Closed on
Jun 5, 2025
Sold by
Holman Dustin and Holman Dustin Rex
Bought by
Holman Dustin and Cassida Holman
Current Estimated Value
Home Financials for this Owner
Home Financials are based on the most recent Mortgage that was taken out on this home.
Original Mortgage
$201,000
Outstanding Balance
$200,479
Interest Rate
6.76%
Mortgage Type
New Conventional
Estimated Equity
$113,680
Purchase Details
Closed on
Sep 9, 2020
Sold by
Kittredge Nancy Wallis
Bought by
Goff David E
Purchase Details
Closed on
Mar 2, 2016
Sold by
Holman Dustin Rex
Bought by
Holman Dustin Rex and Holman Courtney
Purchase Details
Closed on
Dec 29, 2015
Sold by
Holman Billy Rex
Bought by
Holman Dustin Rex
Purchase Details
Closed on
May 18, 1988
Bought by
Holdman Billy Rex
Purchase Details
Closed on
Jan 2, 1900
Create a Home Valuation Report for This Property
The Home Valuation Report is an in-depth analysis detailing your home's value as well as a comparison with similar homes in the area
Home Values in the Area
Average Home Value in this Area
Purchase History
| Date | Buyer | Sale Price | Title Company |
|---|---|---|---|
| Holman Dustin | -- | Service Link | |
| Holman Dustin | -- | Service Link | |
| Goff David E | -- | None Available | |
| Holman Dustin Rex | -- | -- | |
| Holman Dustin Rex | -- | -- | |
| Holdman Billy Rex | -- | -- | |
| -- | -- | -- |
Source: Public Records
Mortgage History
| Date | Status | Borrower | Loan Amount |
|---|---|---|---|
| Open | Holman Dustin | $201,000 | |
| Closed | Holman Dustin | $201,000 |
Source: Public Records
Tax History Compared to Growth
Tax History
| Year | Tax Paid | Tax Assessment Tax Assessment Total Assessment is a certain percentage of the fair market value that is determined by local assessors to be the total taxable value of land and additions on the property. | Land | Improvement |
|---|---|---|---|---|
| 2025 | $936 | $75,975 | $0 | $0 |
| 2024 | $936 | $45,675 | $6,800 | $38,875 |
| 2023 | $936 | $45,675 | $6,800 | $38,875 |
| 2022 | $936 | $45,675 | $6,800 | $38,875 |
| 2021 | $936 | $45,675 | $6,800 | $38,875 |
| 2020 | $936 | $45,675 | $6,800 | $38,875 |
| 2019 | $782 | $38,150 | $5,475 | $32,675 |
| 2018 | $782 | $38,150 | $5,475 | $32,675 |
| 2017 | $753 | $36,750 | $5,475 | $31,275 |
| 2016 | $185 | $9,000 | $5,475 | $3,525 |
| 2015 | $167 | $9,000 | $5,475 | $3,525 |
| 2014 | -- | $9,000 | $5,475 | $3,525 |
| 2013 | -- | $8,800 | $5,600 | $3,200 |
Source: Public Records
Map
Nearby Homes
- 2025 Old Bon Air Rd
- 498 Low Gap Rd
- 708 Low Gap Rd
- 665 Camp Belle Air Rd
- 214 Holiday Ln
- 179 Holiday Ln
- 179 Holiday Lane Sparta Ln
- 210 Kingwood Dr
- 5185 Crossville Hwy
- 171 Brush Wood Dr
- 319 Grandview Dr
- 0 Vandy Cir
- 362 Vandy Cir
- 6232 Crossville Hwy
- .23 ac Olen Ln
- 0 Old Bon Air Rd
- 6555 Crossville Hwy
- 3908 Lost Creek Rd
- 245 Woolf Pass Ln
- 00 Lost Creek Rd
- 2528 Old Bon Air Rd
- 8.5 Ac Old Bonair Rd
- LOT 2 Old Bonair Rd
- LOT 3 Old Bonair Rd
- LOT 1 Old Bonair Rd
- 5.7 AC Old Bonair Rd
- 5.325 AC Old Bonair Rd
- 5.3 AC Old Bonair Rd
- 000 Old Bonair Rd
- Tract 2 Old Bonair Rd
- Tract 1 Old Bonair Rd
- Tract 3 Old Bonair Rd
- 3863 Old Bonair Rd
- 2429 Old Bon Air Rd
- 195 Rex Ln
- 2573 Old Bon Air Rd
- 325 Rex Ln
- 140 Gladstone Acres Rd
- 400 Rex Ln
- 400 Rex Ln