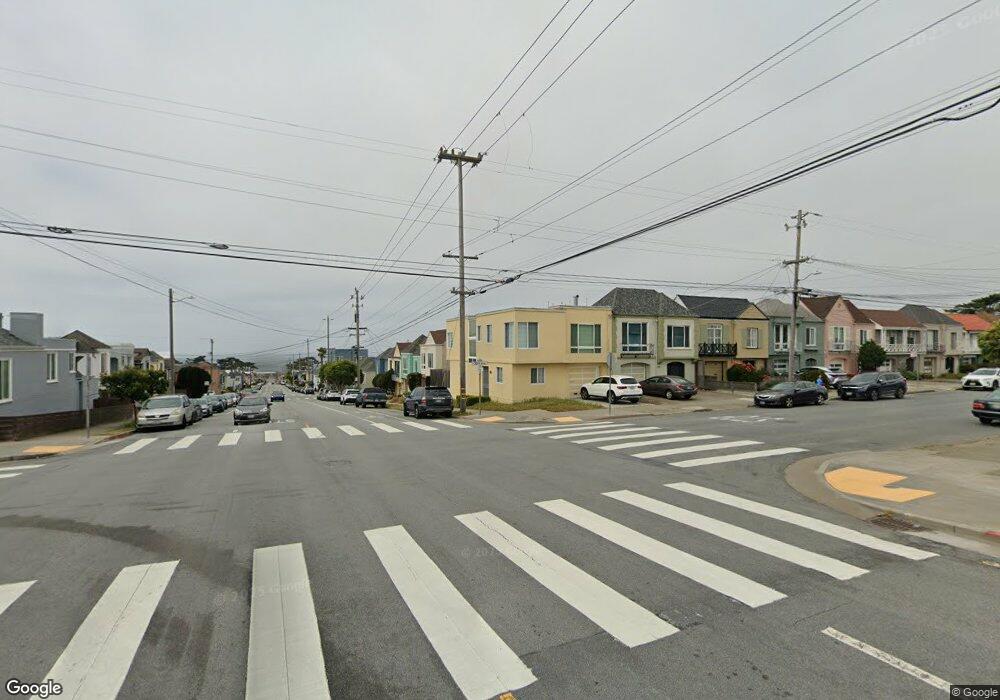
2500 Ortega St San Francisco, CA 94122
Central Sunset NeighborhoodEstimated Value: $1,364,000 - $1,863,000
2
Beds
1
Bath
1,397
Sq Ft
$1,098/Sq Ft
Est. Value
About This Home
This home is located at 2500 Ortega St, San Francisco, CA 94122 and is currently estimated at $1,534,012, approximately $1,098 per square foot. 2500 Ortega St is a home located in San Francisco County with nearby schools including Stevenson (Robert Louis) Elementary School, Giannini (A.P.) Middle School, and Cornerstone Academy-Lawton Campus.
Ownership History
Date
Name
Owned For
Owner Type
Purchase Details
Closed on
Sep 21, 2016
Sold by
Liu Andrew K and Liu Alexandra X
Bought by
Liu Andrew K and Liu Alexandra X
Current Estimated Value
Purchase Details
Closed on
Apr 26, 1996
Sold by
Chakerian Kerop and Chakerian Maritza
Bought by
Liu Andrew K and Liu Alexandra Xie
Home Financials for this Owner
Home Financials are based on the most recent Mortgage that was taken out on this home.
Original Mortgage
$207,000
Outstanding Balance
$11,601
Interest Rate
7.82%
Estimated Equity
$1,522,411
Create a Home Valuation Report for This Property
The Home Valuation Report is an in-depth analysis detailing your home's value as well as a comparison with similar homes in the area
Home Values in the Area
Average Home Value in this Area
Purchase History
| Date | Buyer | Sale Price | Title Company |
|---|---|---|---|
| Liu Andrew K | -- | None Available | |
| Liu Andrew K | $259,000 | Fidelity National Title Ins |
Source: Public Records
Mortgage History
| Date | Status | Borrower | Loan Amount |
|---|---|---|---|
| Open | Liu Andrew K | $207,000 |
Source: Public Records
Tax History Compared to Growth
Tax History
| Year | Tax Paid | Tax Assessment Tax Assessment Total Assessment is a certain percentage of the fair market value that is determined by local assessors to be the total taxable value of land and additions on the property. | Land | Improvement |
|---|---|---|---|---|
| 2025 | $5,648 | $430,236 | $207,645 | $222,591 |
| 2024 | $5,648 | $421,801 | $203,574 | $218,227 |
| 2023 | $5,554 | $413,532 | $199,583 | $213,949 |
| 2022 | $5,433 | $405,424 | $195,670 | $209,754 |
| 2021 | $5,331 | $397,476 | $191,834 | $205,642 |
| 2020 | $5,371 | $393,401 | $189,867 | $203,534 |
| 2019 | $5,189 | $385,689 | $186,145 | $199,544 |
| 2018 | $5,015 | $378,128 | $182,496 | $195,632 |
| 2017 | $4,656 | $370,715 | $178,918 | $191,797 |
| 2016 | $4,555 | $363,447 | $175,410 | $188,037 |
| 2015 | $4,496 | $357,989 | $172,776 | $185,213 |
| 2014 | $4,378 | $350,977 | $169,392 | $181,585 |
Source: Public Records
Map
Nearby Homes
