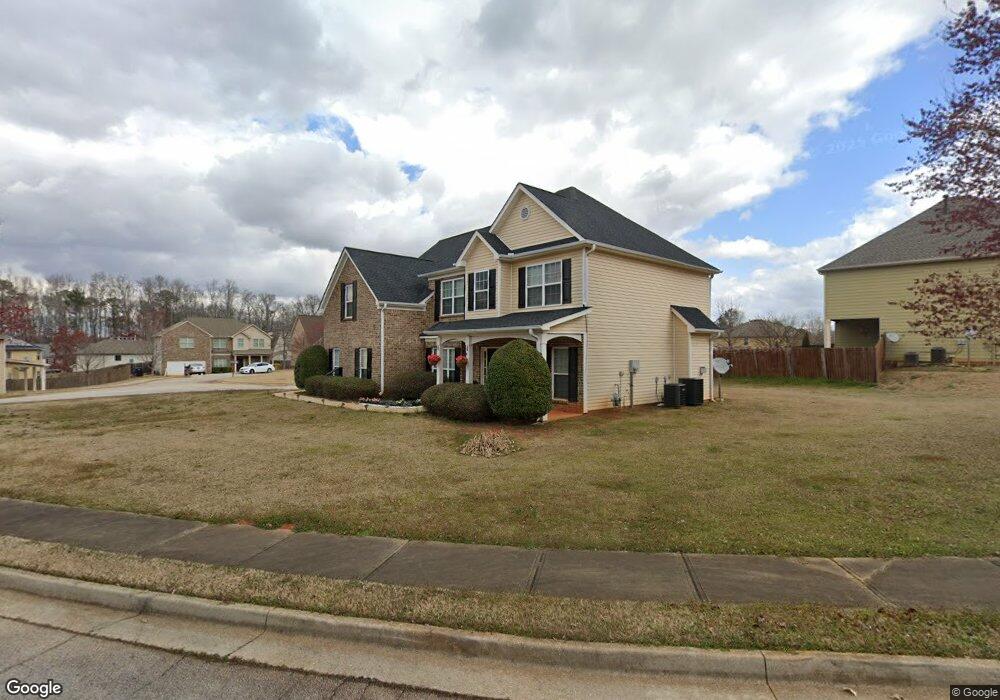
2500 Ruskin Ct McDonough, GA 30253
Estimated Value: $325,000 - $366,000
4
Beds
3
Baths
2,729
Sq Ft
$126/Sq Ft
Est. Value
About This Home
This home is located at 2500 Ruskin Ct, McDonough, GA 30253 and is currently estimated at $344,039, approximately $126 per square foot. 2500 Ruskin Ct is a home located in Henry County with nearby schools including Luella Elementary School, Luella Middle School, and Luella High School.
Ownership History
Date
Name
Owned For
Owner Type
Purchase Details
Closed on
Jun 5, 2024
Sold by
Sfr Jv 2 Property Llc
Bought by
Sfrjv2 2024 2 Borrower Llc
Current Estimated Value
Purchase Details
Closed on
Feb 13, 2023
Sold by
Bisnauth Ravindra
Bought by
Sfr Jv 2 Property Llc
Purchase Details
Closed on
Nov 19, 2018
Sold by
Jagroo Dipchan
Bought by
Bisnauth Ravindra
Purchase Details
Closed on
Jul 27, 2006
Sold by
Huco Const Llc
Bought by
Jagroo Dipchan
Home Financials for this Owner
Home Financials are based on the most recent Mortgage that was taken out on this home.
Original Mortgage
$210,050
Interest Rate
6.6%
Mortgage Type
VA
Purchase Details
Closed on
May 30, 2006
Sold by
Westridge Partners Ii Llc
Bought by
Huco Const Llc
Home Financials for this Owner
Home Financials are based on the most recent Mortgage that was taken out on this home.
Original Mortgage
$210,050
Interest Rate
6.6%
Mortgage Type
VA
Create a Home Valuation Report for This Property
The Home Valuation Report is an in-depth analysis detailing your home's value as well as a comparison with similar homes in the area
Home Values in the Area
Average Home Value in this Area
Purchase History
| Date | Buyer | Sale Price | Title Company |
|---|---|---|---|
| Sfrjv2 2024 2 Borrower Llc | -- | -- | |
| Sfr Jv 2 Property Llc | $305,000 | -- | |
| Bisnauth Ravindra | -- | -- | |
| Jagroo Dipchan | $203,400 | -- | |
| Huco Const Llc | $212,500 | -- |
Source: Public Records
Mortgage History
| Date | Status | Borrower | Loan Amount |
|---|---|---|---|
| Previous Owner | Jagroo Dipchan | $210,050 | |
| Previous Owner | Huco Const Llc | $752,350 |
Source: Public Records
Tax History Compared to Growth
Tax History
| Year | Tax Paid | Tax Assessment Tax Assessment Total Assessment is a certain percentage of the fair market value that is determined by local assessors to be the total taxable value of land and additions on the property. | Land | Improvement |
|---|---|---|---|---|
| 2025 | $5,937 | $148,520 | $16,000 | $132,520 |
| 2024 | $5,937 | $122,000 | $14,152 | $107,848 |
| 2023 | $5,310 | $136,720 | $14,000 | $122,720 |
| 2022 | $4,060 | $104,120 | $14,000 | $90,120 |
| 2021 | $3,428 | $87,640 | $14,000 | $73,640 |
| 2020 | $3,277 | $83,720 | $10,000 | $73,720 |
| 2019 | $3,001 | $76,520 | $10,000 | $66,520 |
| 2018 | $2,707 | $68,840 | $12,800 | $56,040 |
| 2016 | $2,754 | $70,080 | $10,000 | $60,080 |
| 2015 | $2,641 | $65,120 | $8,800 | $56,320 |
| 2014 | $2,414 | $58,680 | $8,000 | $50,680 |
Source: Public Records
Map
Nearby Homes
- 1313 Jubilee Ln
- 2093 Parador Bend
- 1441 Trellis Ct
- 1441 Trellis Ct Unit (LOT 7)
- 2200 Highway 20 W
- 461 Arbor Chase
- 1533 Rolling Meadows Dr
- 276 Oakland Rd
- 400 Savannah Place
- 505 Stone Rd
- 203 Nail Dr
- 133 Nail Dr
- 15 Oak Hill Ct
- 491 Highway 81
- 1478 Elena Dr
- 2026 Gates Ct
- 112 Bridget Dr
- 344 Williamsburg Cir Unit 1
- 1749 Misselthrush Ln
- 272 Stone Rd
- 2338 Braelin Loop Unit 263
- 2338 Braelin Loop
- 2508 Ruskin Ct
- 2332 Braelin Loop Unit 262
- 2332 Braelin Loop
- 2512 Ruskin Ct Unit 266
- 2512 Ruskin Ct
- 2501 Ruskin Ct
- 2328 Braelin Loop
- 2505 Ruskin Ct Unit 269
- 2505 Ruskin Ct
- 2509 Ruskin Ct
- 2513 Ruskin Ct
- 2701 Marisol Way
- 2357 Braelin Loop
- 2353 Braelin Loop
- 2304 Braelin Loop
- 2372 Braelin Loop
- 2300 Braelin Loop Unit 280
- 2300 Braelin Loop