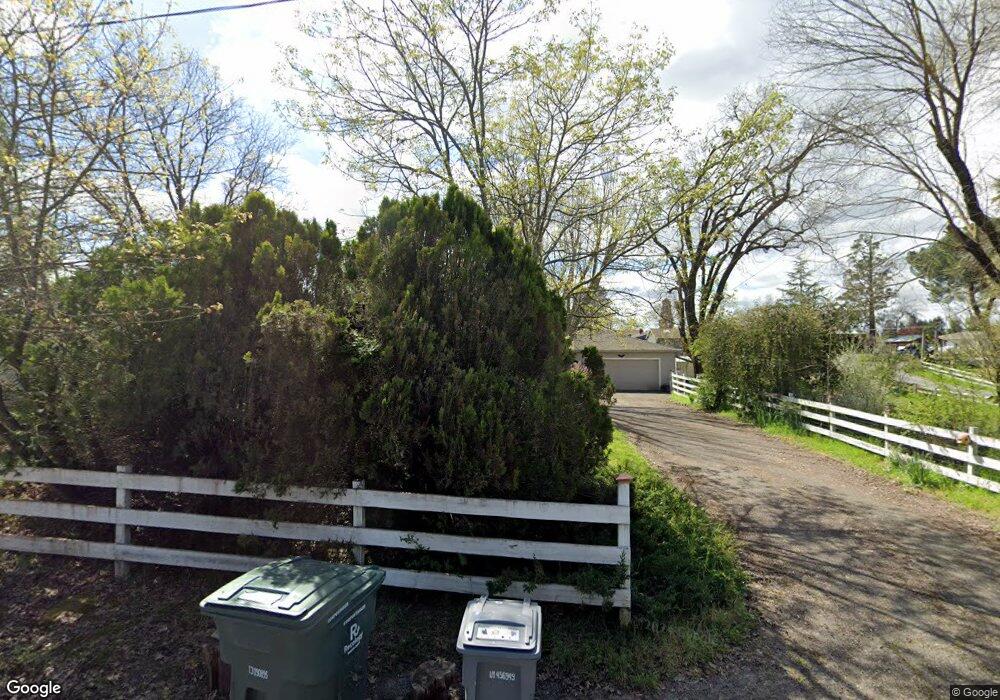
2500 Silk Rd Windsor, CA 95492
Estimated Value: $763,000 - $1,166,000
2
Beds
2
Baths
1,805
Sq Ft
$532/Sq Ft
Est. Value
About This Home
This home is located at 2500 Silk Rd, Windsor, CA 95492 and is currently estimated at $959,596, approximately $531 per square foot. 2500 Silk Rd is a home located in Sonoma County with nearby schools including Mattie Washburn Elementary School, Brooks Elementary School, and Windsor Middle School.
Ownership History
Date
Name
Owned For
Owner Type
Purchase Details
Closed on
Jul 2, 2014
Sold by
Green Grass Inc
Bought by
The Kenneth George Sheeper & Sandra Lee
Current Estimated Value
Purchase Details
Closed on
Feb 27, 2014
Sold by
Erickson Patricia A and Dawes Nancy J
Bought by
Green Grass Inc
Purchase Details
Closed on
Jun 29, 2001
Sold by
Erickson Patricia A and Dawes Nancy J
Bought by
Erickson Patricia A and Dawes Nancy J
Create a Home Valuation Report for This Property
The Home Valuation Report is an in-depth analysis detailing your home's value as well as a comparison with similar homes in the area
Home Values in the Area
Average Home Value in this Area
Purchase History
| Date | Buyer | Sale Price | Title Company |
|---|---|---|---|
| The Kenneth George Sheeper & Sandra Lee | $643,500 | First American Title Company | |
| Green Grass Inc | $350,000 | None Available | |
| Erickson Patricia A | -- | -- |
Source: Public Records
Tax History
| Year | Tax Paid | Tax Assessment Tax Assessment Total Assessment is a certain percentage of the fair market value that is determined by local assessors to be the total taxable value of land and additions on the property. | Land | Improvement |
|---|---|---|---|---|
| 2025 | $8,894 | $773,381 | $309,472 | $463,909 |
| 2024 | $8,894 | $758,217 | $303,404 | $454,813 |
| 2023 | $8,894 | $743,351 | $297,455 | $445,896 |
| 2022 | $8,567 | $728,776 | $291,623 | $437,153 |
| 2021 | $8,408 | $714,487 | $285,905 | $428,582 |
| 2020 | $8,601 | $707,162 | $282,974 | $424,188 |
| 2019 | $8,561 | $693,297 | $277,426 | $415,871 |
| 2018 | $8,478 | $679,704 | $271,987 | $407,717 |
| 2017 | $8,393 | $666,377 | $266,654 | $399,723 |
| 2016 | $7,880 | $653,312 | $261,426 | $391,886 |
| 2015 | $7,654 | $643,500 | $257,500 | $386,000 |
| 2014 | $3,218 | $251,135 | $100,454 | $150,681 |
Source: Public Records
Map
Nearby Homes
- 1439 Birdie Dr
- 1332 Eagle Dr
- 1384 Birdie Dr
- 8596 Starr Rd
- 925 Pinot Noir Way
- 7225 16th Hole Dr
- 1349 Golf Course Dr
- 7830 Foppiano Way
- 8484 Trione Cir
- 107 Bouquet Cir
- 705 Shiloh Rd
- 8145 Willow St
- 8148 D St
- 1038 Capewood Ln
- 8156 D St
- 3000 River Rd
- 353 Patrick Ln
- 8147 Willow St
- 1138 Broadleaf Ln
- 1145 Portello Ln
Your Personal Tour Guide
Ask me questions while you tour the home.