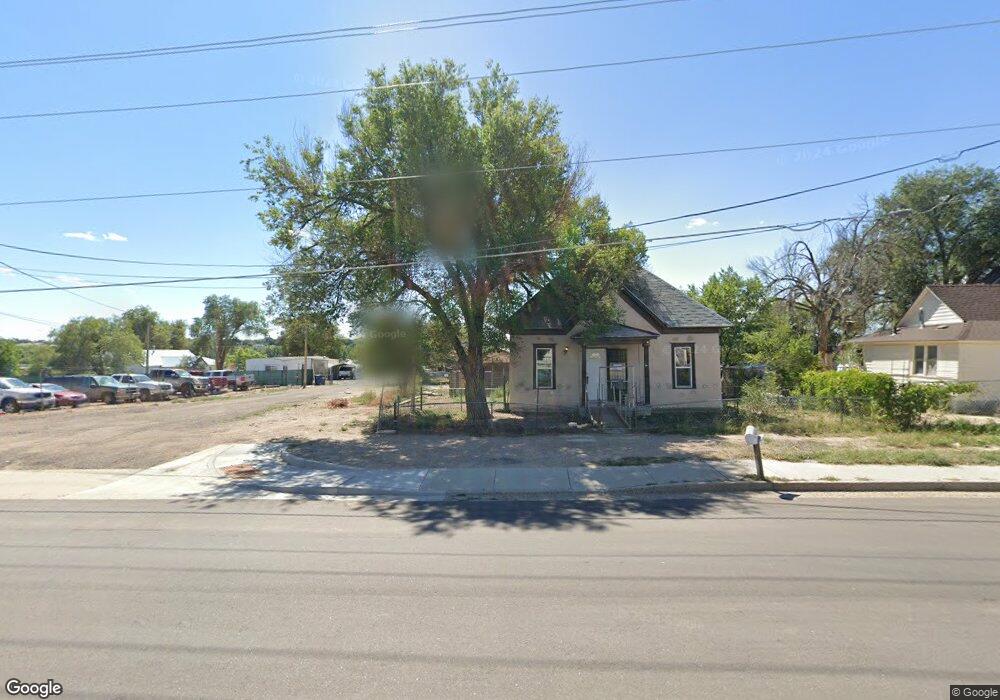
2500 W 11th St Pueblo, CO 81003
Hyde Park NeighborhoodEstimated Value: $56,864 - $181,000
2
Beds
1
Bath
936
Sq Ft
$127/Sq Ft
Est. Value
About This Home
This home is located at 2500 W 11th St, Pueblo, CO 81003 and is currently estimated at $118,932, approximately $127 per square foot. 2500 W 11th St is a home located in Pueblo County with nearby schools including Irving Elementary School, Risley International Academy of Innovation, and Centennial High School.
Ownership History
Date
Name
Owned For
Owner Type
Purchase Details
Closed on
Mar 18, 2024
Sold by
Mckee Daniel D
Bought by
Tioga Pass Holdings 4 Llc
Current Estimated Value
Purchase Details
Closed on
Feb 21, 2017
Sold by
Manchester Kristen L
Bought by
Mckee Daniel D
Purchase Details
Closed on
Aug 13, 2007
Sold by
Mckee Daniel D
Bought by
Manchester Kristen L
Purchase Details
Closed on
Mar 22, 2007
Sold by
Washington Mutual Bank
Bought by
Mckee Daniel
Purchase Details
Closed on
Jan 31, 2007
Sold by
Mcmurrey Teresa
Bought by
Washington Mutual Bank
Purchase Details
Closed on
Dec 18, 1992
Sold by
Pueblo Bank + Trust Co
Bought by
Mcmurrey Teresa
Purchase Details
Closed on
Jan 7, 1992
Sold by
Donley David L + Richard E
Bought by
Pueblo Bank + Trust Co
Purchase Details
Closed on
Jan 3, 1974
Sold by
Donley Leslie E + Velma M
Bought by
Donley David L + Richard E
Create a Home Valuation Report for This Property
The Home Valuation Report is an in-depth analysis detailing your home's value as well as a comparison with similar homes in the area
Home Values in the Area
Average Home Value in this Area
Purchase History
| Date | Buyer | Sale Price | Title Company |
|---|---|---|---|
| Tioga Pass Holdings 4 Llc | -- | None Listed On Document | |
| Mckee Daniel D | -- | None Available | |
| Manchester Kristen L | -- | None Available | |
| Mckee Daniel | $23,400 | Chicago Title Co | |
| Washington Mutual Bank | -- | None Available | |
| Mcmurrey Teresa | $18,900 | -- | |
| Pueblo Bank + Trust Co | -- | -- | |
| Donley David L + Richard E | $240,000 | -- |
Source: Public Records
Tax History Compared to Growth
Tax History
| Year | Tax Paid | Tax Assessment Tax Assessment Total Assessment is a certain percentage of the fair market value that is determined by local assessors to be the total taxable value of land and additions on the property. | Land | Improvement |
|---|---|---|---|---|
| 2024 | $499 | -- | -- | -- |
| 2023 | $504 | $8,730 | $940 | $7,790 |
| 2022 | $463 | $4,660 | $420 | $4,240 |
| 2021 | $478 | $4,800 | $430 | $4,370 |
| 2020 | $346 | $4,460 | $430 | $4,030 |
| 2019 | $347 | $3,437 | $215 | $3,222 |
| 2018 | $245 | $2,706 | $216 | $2,490 |
| 2017 | $248 | $2,706 | $216 | $2,490 |
| 2016 | $246 | $2,709 | $239 | $2,470 |
| 2015 | $245 | $2,709 | $239 | $2,470 |
| 2014 | $237 | $2,614 | $239 | $2,375 |
Source: Public Records
Map
Nearby Homes
- 2308 W 14th St
- 2215 W 14th St
- 2031 W 11th St
- 2024 W 11th St
- 2701 W 11th St
- 2408 W 15th St
- 2206 W 16th St
- 2900 W 11th St
- 2028 W 15th St
- 2318 W 17th St
- 2402 W 17th St
- TBD Garnett St
- TBD No Site Address
- 2434 W 19th St
- 2108 W 19th St
- 2423 W 19th St
- 2337 Cruz Ct
- 6 Lee Ln
- 1306 W Abriendo Ave
- 105 Aberdeen Bluffs