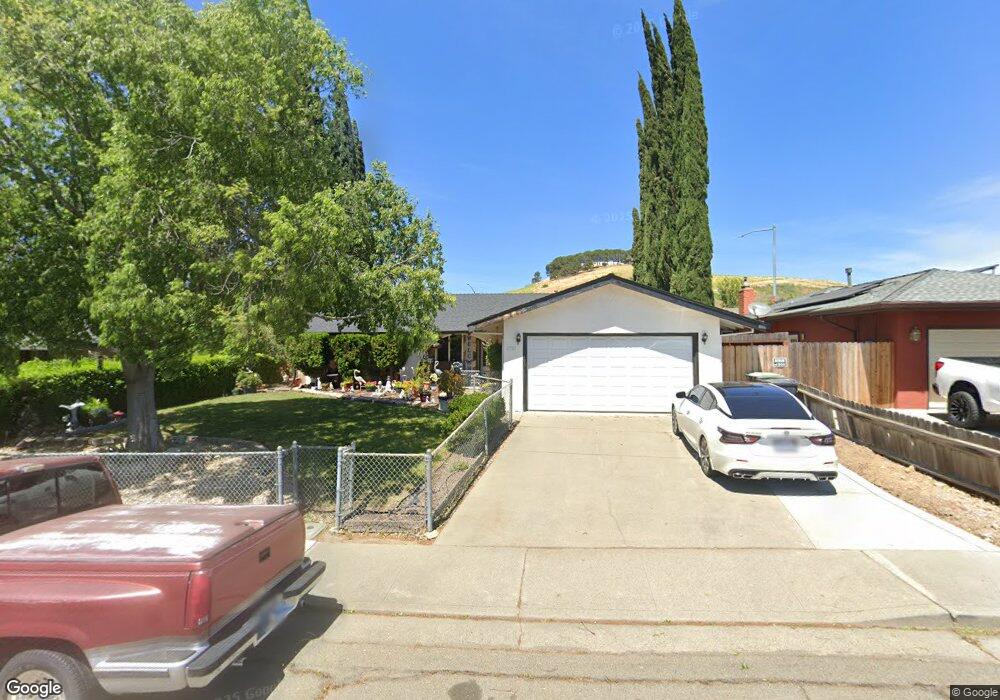
2501 Carnation Dr Fairfield, CA 94533
Estimated Value: $480,000 - $530,000
3
Beds
2
Baths
1,337
Sq Ft
$375/Sq Ft
Est. Value
About This Home
This home is located at 2501 Carnation Dr, Fairfield, CA 94533 and is currently estimated at $501,923, approximately $375 per square foot. 2501 Carnation Dr is a home located in Solano County with nearby schools including Dover Elementary School, Grange Middle School, and Fairfield High School.
Ownership History
Date
Name
Owned For
Owner Type
Purchase Details
Closed on
Mar 3, 2010
Sold by
Fox Mario
Bought by
Perrin Helen K
Current Estimated Value
Home Financials for this Owner
Home Financials are based on the most recent Mortgage that was taken out on this home.
Original Mortgage
$137,464
Outstanding Balance
$91,743
Interest Rate
5.12%
Mortgage Type
FHA
Estimated Equity
$410,180
Purchase Details
Closed on
Dec 9, 2003
Sold by
Fox Tricia W
Bought by
Fox Mario
Home Financials for this Owner
Home Financials are based on the most recent Mortgage that was taken out on this home.
Original Mortgage
$15,200
Interest Rate
5.86%
Mortgage Type
Credit Line Revolving
Purchase Details
Closed on
Nov 22, 2002
Sold by
Fox Sault R
Bought by
Fox Mario
Home Financials for this Owner
Home Financials are based on the most recent Mortgage that was taken out on this home.
Original Mortgage
$160,550
Interest Rate
6.28%
Mortgage Type
Stand Alone First
Purchase Details
Closed on
Aug 16, 2002
Sold by
Fox Tricia W
Bought by
Fox Mario
Purchase Details
Closed on
Apr 26, 1996
Sold by
Fox Sault R
Bought by
Fox Sault R
Create a Home Valuation Report for This Property
The Home Valuation Report is an in-depth analysis detailing your home's value as well as a comparison with similar homes in the area
Home Values in the Area
Average Home Value in this Area
Purchase History
| Date | Buyer | Sale Price | Title Company |
|---|---|---|---|
| Perrin Helen K | $140,000 | First American Title Company | |
| Fox Mario | -- | -- | |
| Fox Mario | $55,000 | Placer Title Company | |
| Fox Mario | -- | Placer Title Company | |
| Fox Mario | -- | -- | |
| Fox Sault R | -- | -- |
Source: Public Records
Mortgage History
| Date | Status | Borrower | Loan Amount |
|---|---|---|---|
| Open | Perrin Helen K | $137,464 | |
| Previous Owner | Fox Mario | $15,200 | |
| Previous Owner | Fox Mario | $160,550 |
Source: Public Records
Tax History Compared to Growth
Tax History
| Year | Tax Paid | Tax Assessment Tax Assessment Total Assessment is a certain percentage of the fair market value that is determined by local assessors to be the total taxable value of land and additions on the property. | Land | Improvement |
|---|---|---|---|---|
| 2025 | $2,039 | $180,701 | $51,627 | $129,074 |
| 2024 | $2,039 | $177,159 | $50,615 | $126,544 |
| 2023 | $1,976 | $173,686 | $49,623 | $124,063 |
| 2022 | $1,953 | $170,281 | $48,650 | $121,631 |
| 2021 | $1,934 | $166,944 | $47,697 | $119,247 |
| 2020 | $1,889 | $165,233 | $47,208 | $118,025 |
| 2019 | $1,843 | $161,994 | $46,283 | $115,711 |
| 2018 | $1,902 | $158,819 | $45,376 | $113,443 |
| 2017 | $1,815 | $155,706 | $44,487 | $111,219 |
| 2016 | $1,795 | $152,654 | $43,615 | $109,039 |
| 2015 | $1,676 | $150,362 | $42,960 | $107,402 |
| 2014 | $1,661 | $147,418 | $42,119 | $105,299 |
Source: Public Records
Map
Nearby Homes
- 2495 Carnation Dr
- 2611 Lilac St
- 393 Manzanita Ave
- 15 Dali Ct
- 41 Goya Dr
- 121 Goya Dr
- 120 Goya Dr
- 81 Del Prado Cir
- 2472 Vista Grande
- 58 Del Prado Cir
- 2289 Rutland Ct
- 2256 Dorset Ln
- 1308 Sunningdale Ln
- 1305 Sunningdale Ln
- 1301 Sunningdale Ln
- Bryce Plan at Brighton Place
- Cora Plan at Brighton Place
- 1300 Sunningdale Ln
- 831 Heath Ct
- 223 Camellia St
- 2521 Carnation Dr
- 2489 Carnation Dr
- 2500 Carnation Dr
- 2520 Carnation Dr
- 2535 Carnation Dr
- 2483 Carnation Dr
- 458 Begonia Blvd
- 2482 Carnation Dr
- 2549 Carnation Dr
- 445 Lily St
- 2477 Carnation Dr
- 471 Begonia Blvd
- 452 Begonia Blvd
- 2550 Carnation Dr
- 2563 Carnation Dr
- 465 Begonia Blvd
- 2471 Carnation Dr
- 446 Lily St