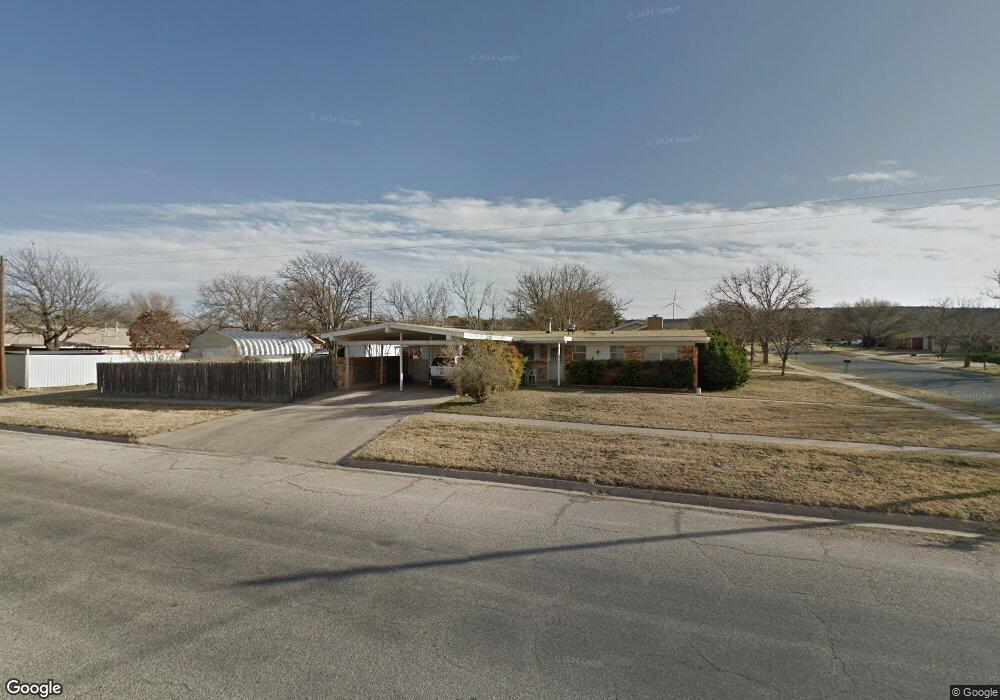
2501 Larry Dr Big Spring, TX 79720
Estimated Value: $197,000 - $216,852
Studio
--
Bath
3,114
Sq Ft
$66/Sq Ft
Est. Value
About This Home
This home is located at 2501 Larry Dr, Big Spring, TX 79720 and is currently estimated at $205,463, approximately $65 per square foot. 2501 Larry Dr is a home located in Howard County with nearby schools including Big Spring High School.
Ownership History
Date
Name
Owned For
Owner Type
Purchase Details
Closed on
Jul 22, 2024
Sold by
Rodriguez Linda Sanchez
Bought by
2501 Larry Llc
Current Estimated Value
Purchase Details
Closed on
Jul 27, 2023
Sold by
Pennymac Loan Services Llc
Bought by
Rodriguez Linda Sanchez
Purchase Details
Closed on
May 10, 2023
Sold by
Avt Title Services Llc
Bought by
Pennymac Loan Services Llc
Purchase Details
Closed on
Sep 20, 2019
Sold by
Bowman Jennifer Denise
Bought by
Chavarria Pete
Home Financials for this Owner
Home Financials are based on the most recent Mortgage that was taken out on this home.
Original Mortgage
$139,428
Interest Rate
4.12%
Mortgage Type
FHA
Purchase Details
Closed on
May 10, 2018
Sold by
Gaston Joyce W
Bought by
Browman Jennifer Denise
Purchase Details
Closed on
Dec 3, 2010
Sold by
Uptergrove Hubert L and Uptergrove Laverna
Bought by
Gaston Jayce W and Bowman Jennifer
Create a Home Valuation Report for This Property
The Home Valuation Report is an in-depth analysis detailing your home's value as well as a comparison with similar homes in the area
Purchase History
| Date | Buyer | Sale Price | Title Company |
|---|---|---|---|
| 2501 Larry Llc | -- | None Listed On Document | |
| Rodriguez Linda Sanchez | -- | Surety Title | |
| Rodriguez Linda Sanchez | -- | Surety Title | |
| Pennymac Loan Services Llc | $114,610 | Avt Title | |
| Chavarria Pete | -- | Surety Title Company | |
| Browman Jennifer Denise | -- | Surety Title Company | |
| Gaston Jayce W | -- | None Available |
Source: Public Records
Mortgage History
| Date | Status | Borrower | Loan Amount |
|---|---|---|---|
| Previous Owner | Chavarria Pete | $139,428 |
Source: Public Records
Tax History
| Year | Tax Paid | Tax Assessment Tax Assessment Total Assessment is a certain percentage of the fair market value that is determined by local assessors to be the total taxable value of land and additions on the property. | Land | Improvement |
|---|---|---|---|---|
| 2025 | $3,162 | $162,172 | $11,973 | $150,199 |
| 2024 | $2,376 | $164,601 | $11,973 | $152,628 |
| 2023 | $2,139 | $170,478 | $10,000 | $160,478 |
| 2022 | $2,823 | $176,560 | $8,000 | $168,560 |
| 2021 | $2,954 | $135,171 | $8,000 | $127,171 |
| 2019 | $2,020 | $79,834 | $8,000 | $71,834 |
| 2018 | $2,428 | $81,032 | $8,000 | $73,032 |
| 2017 | $2,420 | $82,225 | $6,800 | $75,425 |
| 2016 | $2,420 | $82,225 | $6,800 | $75,425 |
| 2015 | -- | $102,138 | $6,000 | $96,138 |
| 2014 | -- | $82,559 | $6,000 | $76,559 |
Source: Public Records
Map
Nearby Homes
- 2405 E 25th St
- 2502 Cindy Ln
- 2604 Ann Dr
- 2300 Cindy Ln
- 2508 E 24th St
- 2701 Larry Dr
- 2507 E 24th St
- 2606 Carol Dr
- 2704 Shirley Dr
- 2308 Brent Dr
- 2706 Shirley Dr
- 2710 Shirley Dr
- 1800 Brent Dr
- 2608 E 24th St
- Lot 31 Miami Cove
- Lot 25 Miami Cove
- 1710 Alabama St
- 1600 E 17th St
- 1908 Morrison Dr
- 2402 S Monticello St
Your Personal Tour Guide
Ask me questions while you tour the home.