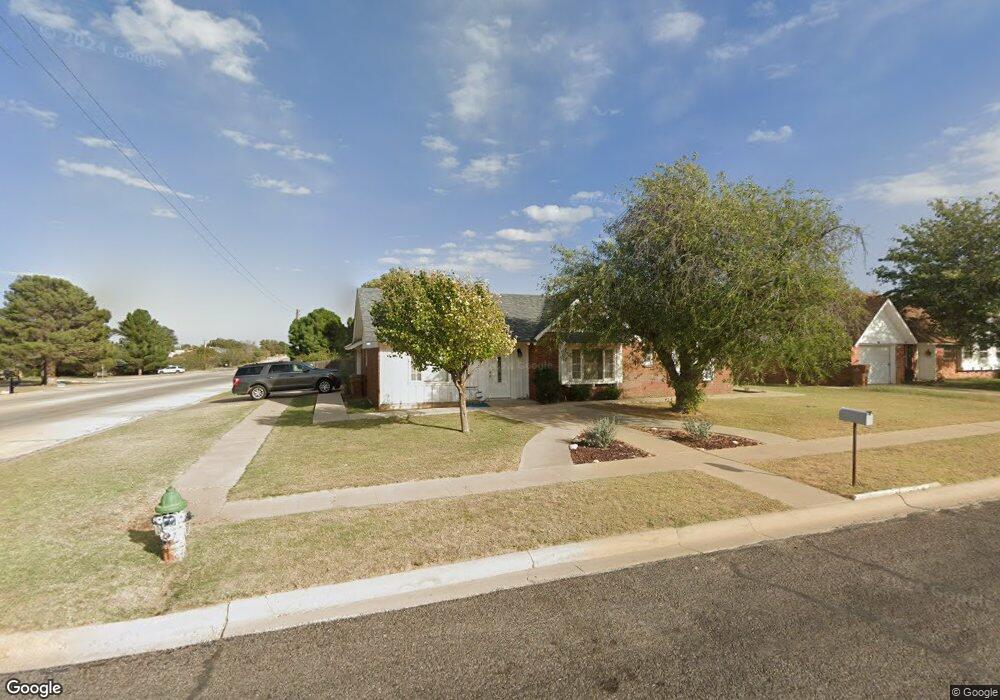
2501 Lynn Dr Big Spring, TX 79720
Estimated Value: $179,955 - $207,000
Studio
--
Bath
2,351
Sq Ft
$83/Sq Ft
Est. Value
About This Home
This home is located at 2501 Lynn Dr, Big Spring, TX 79720 and is currently estimated at $195,989, approximately $83 per square foot. 2501 Lynn Dr is a home located in Howard County with nearby schools including Big Spring High School.
Ownership History
Date
Name
Owned For
Owner Type
Purchase Details
Closed on
Apr 28, 2016
Sold by
Castle Jacob and Castle Arielle
Bought by
Arnoldy Daniel J and Arnoldy Kristen
Current Estimated Value
Home Financials for this Owner
Home Financials are based on the most recent Mortgage that was taken out on this home.
Original Mortgage
$140,456
Outstanding Balance
$110,859
Interest Rate
3.73%
Mortgage Type
VA
Estimated Equity
$85,130
Purchase Details
Closed on
May 30, 2013
Sold by
Moughon Edward and Moughon Rebecca
Bought by
Castle Jacob and Castle Arielle
Home Financials for this Owner
Home Financials are based on the most recent Mortgage that was taken out on this home.
Original Mortgage
$90,201
Interest Rate
3.25%
Mortgage Type
FHA
Purchase Details
Closed on
Oct 21, 2009
Sold by
Quigley Elvira R
Bought by
Moughon Edward and Moughon Rebecca
Home Financials for this Owner
Home Financials are based on the most recent Mortgage that was taken out on this home.
Original Mortgage
$85,877
Interest Rate
5.03%
Mortgage Type
FHA
Create a Home Valuation Report for This Property
The Home Valuation Report is an in-depth analysis detailing your home's value as well as a comparison with similar homes in the area
Purchase History
| Date | Buyer | Sale Price | Title Company |
|---|---|---|---|
| Arnoldy Daniel J | -- | Surety Title Company | |
| Castle Jacob | -- | Surety Title Company | |
| Moughon Edward | -- | Howard County Abstract |
Source: Public Records
Mortgage History
| Date | Status | Borrower | Loan Amount |
|---|---|---|---|
| Open | Arnoldy Daniel J | $140,456 | |
| Previous Owner | Castle Jacob | $90,201 | |
| Previous Owner | Moughon Edward | $85,877 |
Source: Public Records
Tax History
| Year | Tax Paid | Tax Assessment Tax Assessment Total Assessment is a certain percentage of the fair market value that is determined by local assessors to be the total taxable value of land and additions on the property. | Land | Improvement |
|---|---|---|---|---|
| 2025 | $1,240 | $144,498 | $11,973 | $132,525 |
| 2024 | $2,571 | $144,498 | $11,973 | $132,525 |
| 2023 | $2,668 | $151,334 | $10,000 | $141,334 |
| 2022 | $3,194 | $156,441 | $8,000 | $148,441 |
| 2021 | $3,367 | $143,272 | $8,000 | $135,272 |
| 2019 | $3,386 | $133,843 | $8,000 | $125,843 |
| 2018 | $4,054 | $135,307 | $8,000 | $127,307 |
| 2017 | $3,164 | $107,504 | $8,000 | $99,504 |
| 2016 | $3,172 | $107,768 | $6,800 | $100,968 |
| 2015 | -- | $102,921 | $6,000 | $96,921 |
| 2014 | -- | $85,889 | $6,000 | $79,889 |
Source: Public Records
Map
Nearby Homes
- 2502 Cindy Ln
- 2500 Larry Dr
- 2405 E 25th St
- 2606 Carol Dr
- 2604 Ann Dr
- 2701 Larry Dr
- 1800 Brent Dr
- 2308 Brent Dr
- 2508 E 24th St
- 2704 Shirley Dr
- 2507 E 24th St
- 2706 Shirley Dr
- 2710 Shirley Dr
- 2608 E 24th St
- Lot 31 Miami Cove
- Lot 25 Miami Cove
- 1600 E 17th St
- 1710 Alabama St
- 1908 Morrison Dr
- 1309 Marijo Ave
Your Personal Tour Guide
Ask me questions while you tour the home.